Samsung 2013 Annual Report Download - page 39
Download and view the complete annual report
Please find page 39 of the 2013 Samsung annual report below. You can navigate through the pages in the report by either clicking on the pages listed below, or by using the keyword search tool below to find specific information within the annual report.-
 1
1 -
2
-
3
-
4
-
5
-
6
-
7
-
8
-
9
-
10
-
11
-
12
-
13
-
14
-
15
-
16
-
17
-
18
-
19
-
20
-
21
-
22
-
23
-
24
-
25
-
26
-
27
-
28
-
 29
29 -
 30
30 -
 31
31 -
 32
32 -
 33
33 -
 34
34 -
 35
35 -
 36
36 -
 37
37 -
 38
38 -
 39
39 -
 40
40 -
 41
41 -
 42
42 -
 43
43 -
 44
44 -
 45
45 -
 46
46 -
 47
47 -
 48
48 -
 49
49 -
50
-
51
-
52
-
53
-
54
-
55
-
56
-
57
-
58
 |
 |
74 75
2013 SAMSUNG ELECTRONICS ANNUAL REPORT
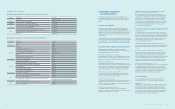
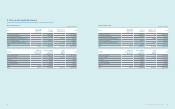
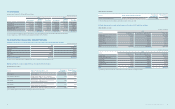
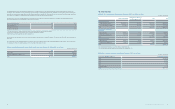
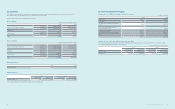
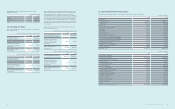
(2) Summary of condensed nancial information of major joint ventures, details of adjustments from the book value of investments in joint ventures,
and dividends from joint ventures as of and for the years ended December 31, 2013 and 2012, are as follows:
(In millions of Korean won)
2013 2012
Samsung Corning
Advanced Glass
Samsung Corning
Precision Materials
Samsung Corning
Advanced Glass
1. Condensed nancial information
Current assets ₩171,353 ₩3,429,581 ₩187,684
- Cash and cash equivalent 64,113 1,707,998 10,887
Non-current assets 95,310 3,731,710 51,669
Current liabilities 42,674 431,475 10,702
- Current nancial liabilities (*1) 40,575 148,492 10,393
Non-current liabilities 67 80,507 103
Non-controlling interests - 8,442 -
Revenue 68,803 3,245,243 30,288
Depreciation and amortization 283 390,091 35
Interest income 4,618 109,710 4,600
Income tax expense (567) 299,996 (178)
2. Details of adjustments from the book value of
investments in joint ventures
Net assets (a) 223,922 6,640,867 228,548
Ownership percentage (*2)(b) 50.0% 42.5% 50.0%
Net assets of equity shares (a x b) 111,961 2,825,104 114,274
Intercompany transactions, etc. (*3) - (30,487) -
Book value of joint ventures 111,961 2,794,617 114,274
3. Dividends from joint ventures
Dividends ₩ -₩927,984 ₩ -
(*1) Account payables, other payables, provisions are excluded.
(*2) Ownership percentage includes common and preferred stocks.
(*3) Consist of unrealized gains and losses, and other differences.
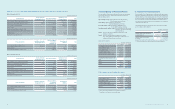
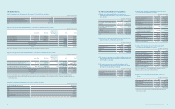
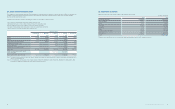
(In millions of Korean won)
2013 2012
Samsung Corning
Advanced Glass Others Samsung Corning
Precision Materials
Samsung Corning
Advanced Glass Others
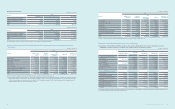
Prot (loss) from continuing operations (*) ₩(4,604) ₩(166,310) ₩1,353,460 ₩(1,452) ₩(129,202)
Other comprehensive income (loss)(*) (21) (1,942) (9,536) - (12,901)
Total comprehensive income (loss)(*) ₩(4,625) ₩(168,252) ₩1,343,924 ₩(1,452) ₩(142,103)
(*) Prot attributable to owners of the parent.
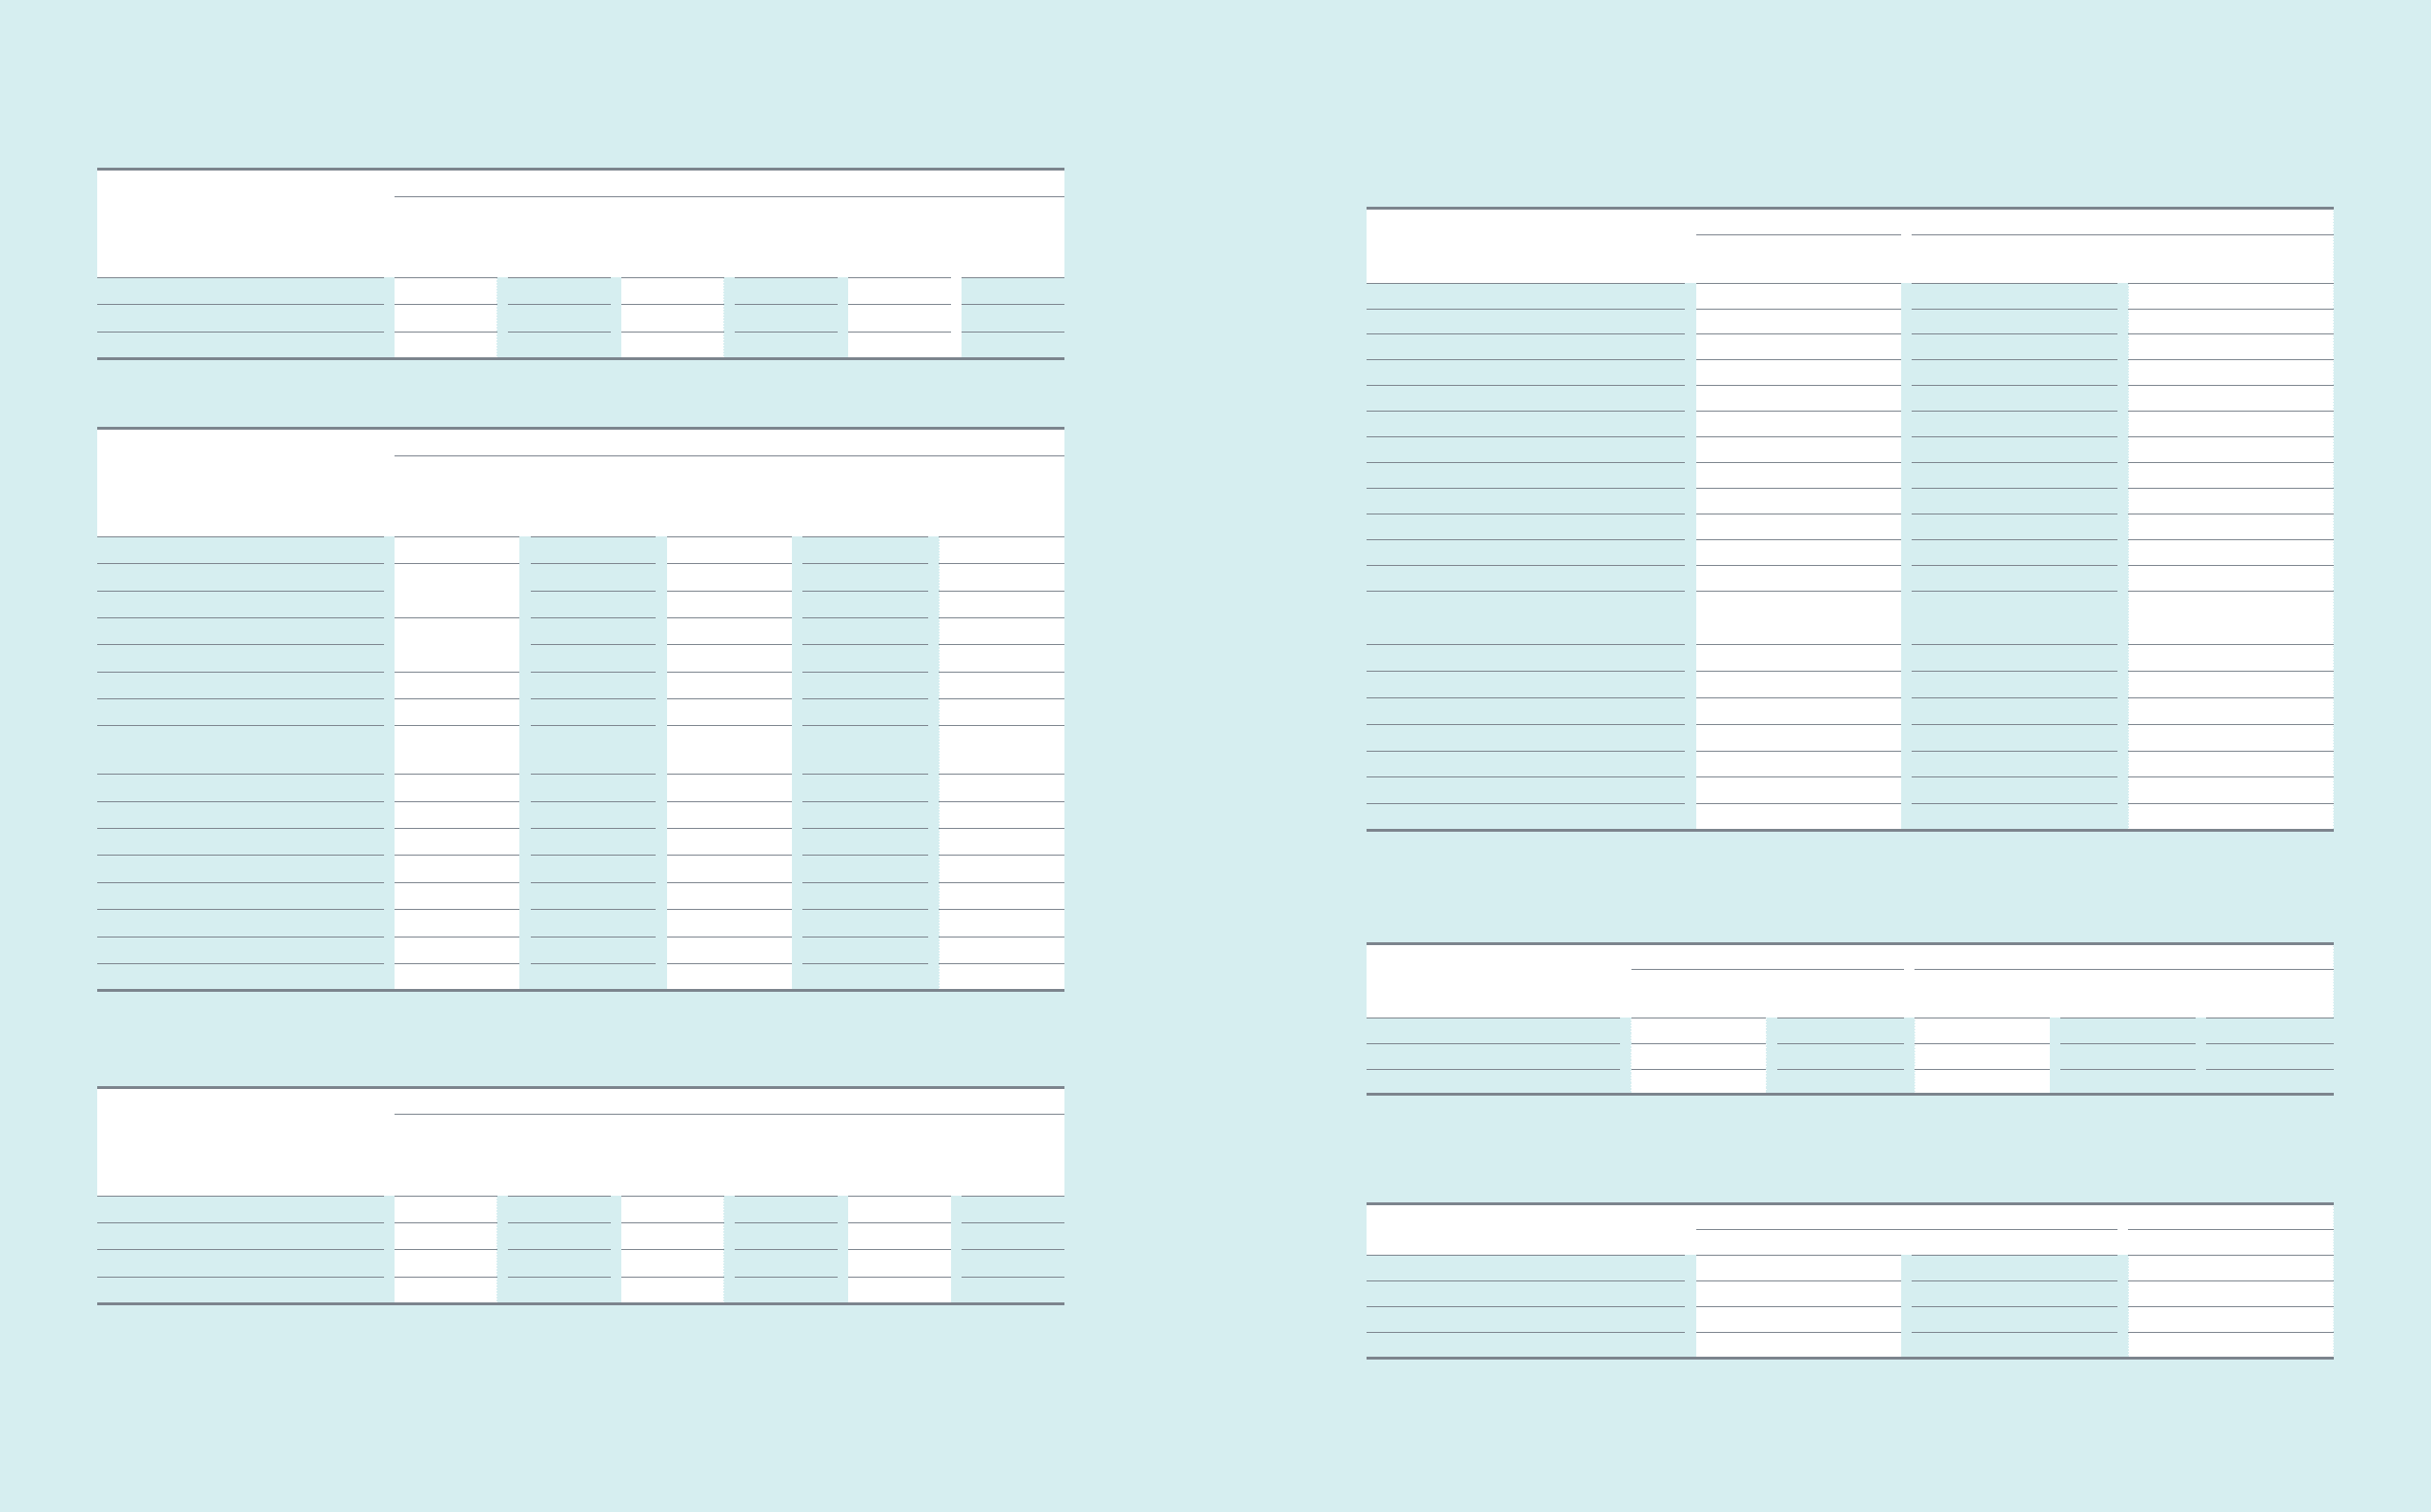
(F) Fair value of marketable investments in associates as of December 31, 2013 and 2012, is as follows:
(In millions of Korean won and number of shares)
Investee
2013 2012
Number of shares held Market value Market value
Samsung SDI 9,282,753 ₩1,503,806 ₩1,401,696
Samsung Electro-Mechanics 17,693,084 1,291,595 1,755,154
Samsung Card 43,393,170 1,622,905 1,583,851
Samsung Techwin 13,526,935 ₩735,865 ₩807,558
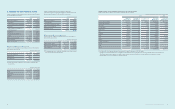
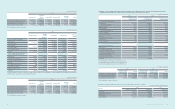
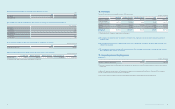
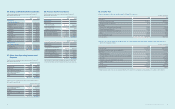
(In millions of Korean won)
2013
Samsung Card
Samsung
Electro-
Mechanics
Samsung SDI Samsung SDS Samsung
Techwin Others
Prot (loss) from continuing operations (*) ₩273,232 ₩330,240 ₩130,599 ₩312,372 ₩132,493 ₩(139,194)
Other comprehensive income (loss) (*) 84,153 26,676 (63,211) (88,703) 21,596 (11,862)
Total comprehensive income (loss) (*) ₩357,385 ₩356,916 ₩67,388 ₩223,669 ₩154,089 ₩(151,056)
(*) Prot attributable to owners of the parent.
(In millions of Korean won)
2012
Samsung Card (*1)
Samsung
Electro-
Mechanics
Samsung SDI Samsung SDS Samsung
Techwin
1. Condensed nancial information
Current assets
₩16,287,816
₩2,631,235 ₩2,414,856 ₩2,283,331 ₩1,386,237
Non-current assets 4,260,230 8,480,231 2,182,077 1,854,702
Current liabilities
10,357,253
1,959,072 2,004,041 1,067,256 1,019,550
Non-current liabilities 966,744 1,326,564 153,211 643,713
Non-controlling interests - 71,252 191,257 60,909 2,094
Revenue 3,817,670 7,912,830 5,771,185 6,105,858 2,934,702
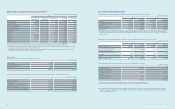
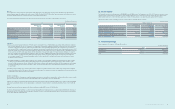
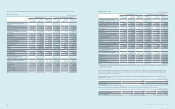
2. Details of adjustments from the book
value of investments in associates
Net assets (a) 5,930,563 3,894,397 7,373,225 3,184,032 1,575,582
Ownership percentage (*2)(b) 37.5% 22.8% 19.7% 21.7% 25.5%
Net assets of equity shares (a x b) 2,221,201 887,933 1,450,811 689,874 401,146
Goodwill 17,181 - - 19,597 -
Intercompany transactions, etc. (309) 2,527 (276,628) (7,663) (40,407)
Book value of associates 2,238,073 890,460 1,174,183 701,808 360,739
3. Dividends from associates
Dividends ₩30,375 ₩13,270 ₩13,924 ₩3,914 ₩6,763
(*1) Samsung Card does not present current and non-current assets, and current and non-current liabilities, as separate classications in its statement of nancial position.
(*2) Ownership percentage includes common and preferred stocks.
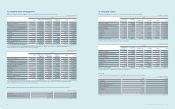
(In millions of Korean won)
2012
Samsung Card
Samsung
Electro-
Mechanics
Samsung SDI Samsung SDS Samsung
Techwin Others
Prot (loss) from continuing operations (*) ₩749,875 ₩411,299 ₩1,471,502 ₩395,805 ₩131,030 ₩(84,072)
Post-tax prot from discontinued operations (*) - 29,503 - - - -
Other comprehensive income (loss)(*) (570,471) 1,009 (150,859) (34,303) (118,743) (34,316)
Total comprehensive income (loss)(*) ₩179,404 ₩441,811 ₩1,320,643 ₩361,502 ₩12,287 ₩(118,388)
(*) Prot attributable to owners of the parent.