Samsung 2013 Annual Report Download - page 22
Download and view the complete annual report
Please find page 22 of the 2013 Samsung annual report below. You can navigate through the pages in the report by either clicking on the pages listed below, or by using the keyword search tool below to find specific information within the annual report.-
 1
1 -
2
-
3
-
4
-
5
-
6
-
7
-
8
-
9
-
10
-
11
-
 12
12 -
 13
13 -
 14
14 -
 15
15 -
 16
16 -
 17
17 -
 18
18 -
 19
19 -
 20
20 -
 21
21 -
 22
22 -
 23
23 -
 24
24 -
 25
25 -
 26
26 -
 27
27 -
 28
28 -
 29
29 -
 30
30 -
 31
31 -
 32
32 -
33
-
34
-
35
-
36
-
37
-
38
-
39
-
40
-
41
-
42
-
43
-
44
-
45
-
46
-
47
-
48
-
49
-
50
-
51
-
52
-
53
-
54
-
55
-
56
-
57
-
58
 |
 |
40 41
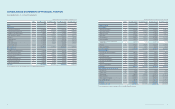
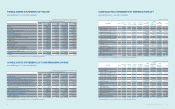
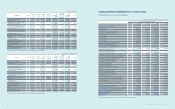
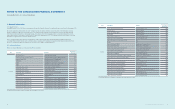
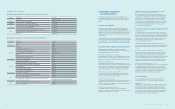
2013 SAMSUNG ELECTRONICS ANNUAL REPORT
(In millions of Korean won, in thousands of US dollars (Note 2.28))
Notes December 31, 2013 December 31, 2012 December 31, 2013 December 31, 2012
KRW KRW USD USD
Liabilities and Equity
Current liabilities
Trade and other payables 6 17,633,705 16,889,350 16,709,661 16,004,312
Short-term borrowings 6, 15 6,438,517 8,443,752 6,101,125 8,001,281
Advances received 1,706,313 1,517,672 1,616,899 1,438,143
Withholdings 1,176,046 966,374 1,114,419 915,734
Accrued expenses 6 11,344,530 9,495,156 10,750,052 8,997,589
Income tax payable 3,386,018 3,222,934 3,208,583 3,054,045
Current portion of long-term borrowings
and debentures 6, 15, 16 2,425,831 999,010 2,298,712 946,660
Provisions 18 6,736,476 5,054,853 6,383,470 4,789,968
Other current liabilities 467,973 343,951 443,450 325,927
Total current liabilities 51,315,409 46,933,052 48,626,371 44,473,659
Non-current liabilities
Long-term trade and other payables 6 1,053,756 1,165,881 998,537 1,104,786
Debentures 6, 16 1,311,068 1,829,374 1,242,365 1,733,511
Long-term borrowings 6, 15 985,117 3,623,028 933,495 3,433,174
Net dened benet liabilities 17 1,854,902 1,729,939 1,757,701 1,639,286
Deferred income tax liabilities 29 6,012,371 3,429,467 5,697,310 3,249,756
Provisions 18 460,924 408,529 436,771 387,121
Other non-current liabilities 1,065,461 472,094 1,009,628 447,355
Total liabilities 64,059,008 59,591,364 60,702,178 56,468,648
Equity attributable to owners of the parent
Preferred stock 20 119,467 119,467 113,207 113,207
Common stock 20 778,047 778,047 737,276 737,276
Share premium 4,403,893 4,403,893 4,173,119 4,173,119
Retained earnings 21 148,600,282 119,985,689 140,813,307 113,698,180
Other components of equity 23 (9,459,073) (8,193,044) (8,963,398) (7,763,711)
Non-controlling interests 5,573,394 4,386,154 5,281,336 4,156,310
Total equity 150,016,010 121,480,206 142,154,847 115,114,381
Total liabilities and equity 214,075,018 181,071,570 202,857,025 171,583,029
The accompanying notes are an integral part of these consolidated nancial statements.
CONSOLIDATED STATEMENTS OF FINANCIAL POSITION
Samsung Electronics Co., Ltd. and its subsidiaries
(In millions of Korean won, in thousands of US dollars (Note 2.28))
Notes December 31, 2013 December 31, 2012 December 31, 2013 December 31, 2012
KRW KRW USD USD
Assets
Current assets
Cash and cash equivalents 4, 6, 7 16,284,780 18,791,460 15,431,422 17,806,747
Short-term nancial instruments 5, 6, 7 36,722,702 17,397,937 34,798,353 16,486,248
Available-for-sale nancial assets 6, 9 1,488,527 1,258,874 1,410,525 1,192,906
Trade and other receivables 6, 7, 10 27,875,934 26,674,596 26,415,175 25,276,790
Advances 1,928,188 1,674,428 1,827,147 1,586,684
Prepaid expenses 2,472,950 2,262,234 2,343,362 2,143,688
Inventories 11 19,134,868 17,747,413 18,132,160 16,817,410
Other current assets 2,135,589 1,462,075 2,023,680 1,385,459
Assets held for sale 12, 37 2,716,733 - 2,574,370 -
Total current assets 110,760,271 87,269,017 104,956,194 82,695,932
Non-current assets
Available-for-sale nancial assets 6,9 6,238,380 5,229,175 5,911,475 4,955,155
Associates and joint ventures 12 6,422,292 8,785,489 6,085,750 8,325,110
Property, plant and equipment 13 75,496,388 68,484,743 71,540,214 64,895,995
Intangible assets 14 3,980,600 3,729,705 3,772,008 3,534,260
Long-term prepaid expenses 3,465,783 3,515,479 3,284,168 3,331,260
Deferred income tax assets 29 4,621,780 2,516,080 4,379,589 2,384,232
Other non-current assets 3,089,524 1,541,882 2,927,627 1,461,085
Total assets 214,075,018 181,071,570 202,857,025 171,583,029
The accompanying notes are an integral part of these consolidated nancial statements.