Samsung 2013 Annual Report Download - page 34
Download and view the complete annual report
Please find page 34 of the 2013 Samsung annual report below. You can navigate through the pages in the report by either clicking on the pages listed below, or by using the keyword search tool below to find specific information within the annual report.-
 1
1 -
2
-
3
-
4
-
5
-
6
-
7
-
8
-
9
-
10
-
11
-
12
-
13
-
14
-
15
-
16
-
17
-
18
-
19
-
20
-
21
-
22
-
23
-
 24
24 -
 25
25 -
 26
26 -
 27
27 -
 28
28 -
 29
29 -
 30
30 -
 31
31 -
 32
32 -
 33
33 -
 34
34 -
 35
35 -
 36
36 -
 37
37 -
 38
38 -
 39
39 -
 40
40 -
 41
41 -
 42
42 -
 43
43 -
 44
44 -
45
-
46
-
47
-
48
-
49
-
50
-
51
-
52
-
53
-
54
-
55
-
56
-
57
-
58
 |
 |

64 65
2013 SAMSUNG ELECTRONICS ANNUAL REPORT
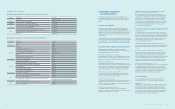
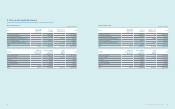
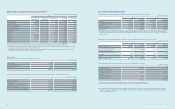
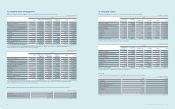
7. Credit Quality of Financial Assets
The credit quality of nancial assets that are neither past due nor impaired
is assessed by reference to external credit ratings as of December 31,
2013 and 2012, as follows:
Superior ability to repay - Aaa~Aa (Moody’s), AAA~AA (S&P, Fitch),
A1 (Credit rating agencies in Korea)
Strong ability to repay - A (Moody’s), A (S&P, Fitch),
A2 (Credit rating agencies in Korea)
Acceptable ability to repay - Baa (Moody’s), BBB (S&P, Fitch),
A3 (Credit rating agencies in Korea)
Currently having the ability to repay - Ba or below (Moody’s), BB or below
(S&P, Fitch), B or below (Creditrating
agencies in Korea)
Group 1 - Customers with the trade payables guaranteed by credit
insurance or collateral
Group 2 - Customers having experienced impairment of capital.
As the trade payables are guaranteed by credit insurance or
collateral, all default risk has been relieved
(A) Accounts receivables
(In millions of Korean won)
2013 2012
Counterparties with external credit rating
Superior ability to repay ₩3,414,467 ₩1,818,158
Strong ability to repay 2,796,881 3,742,515
Acceptable ability to repay 2,491,635 3,217,663
Currently having the ability to repay 4,370,114 3,834,957
13,073,097 12,613,293
Counterparties without external credit
rating
Group 1 9,429,612 8,680,397
Group 2 153,770 50,160
9,583,382 8,730,557
₩22,656,479 ₩21,343,850
(B) Cash equivalents and short-term nancial instruments
(In millions of Korean won)
2013 2012
Superior ability to repay ₩2,584,121 ₩2,850,476
Strong ability to repay 49,891,037 32,675,712
Acceptable ability to repay 493,383 505,631
Currently having the ability to repay 1,111 12,896
Others (*) 23,376 131,782
₩52,993,028 ₩36,176,497
(*) Short-term nancial instruments held at nancial institutions
(Credit union, etc.) without external credit rating.
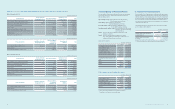
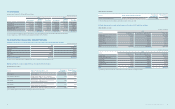
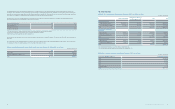
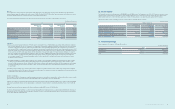
8. Transfer of Financial Assets
Trade receivables of the Company have been discounted through factoring
agreements with banks in 2013 and 2012. Collaterals (trade receivables and
other) provided in such factoring transactions do not meet the requirements
for asset derecognition as risks and rewards are not substantially transferred
in the event the debtor defaults. Financial liabilities recognized in relation to
these transactions are included as short-term borrowings on the statements
of nancial position (Note 15).
The following table presents a breakdown of discounted trade receivables
as of December 31, 2013 and 2012:
(In millions of Korean won)
2013 2012
Carrying amount of the discounted
trade receivables (*) ₩3,256,935 ₩4,328,503
Carrying amount of the related
borrowings 3,256,935 4,328,503
(*) The discounted trade receivables include intercompany balances.
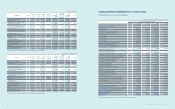
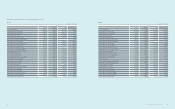
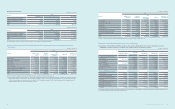
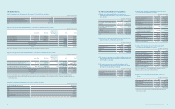
(B) Net gains or net losses on each category of nancial instruments for the years ended December 31, 2013 and 2012, are as follows:
(1) As of December 31, 2013
(In millions of Korean won)
Financial Assets Assets at fair value
through prot or loss Loans and receivables Available-for-sale
nancial assets Total
Gain on valuation (other comprehensive income) ₩ -₩ -₩1,271,817 ₩1,271,817
Gain/(loss) on valuation/disposal (prot or loss) (32,867) (33,518) 1,079,393 1,013,008
Loss on valuation (reclassication) - - (1,000,260) (1,000,260)
Interest income - 1,342,394 9,215 1,351,609
Foreign exchange differences (prot or loss) - (393,407) - (393,407)
Foreign exchange differences (other comprehensive income) - - 939 939
Dividend income - - 112,159 112,159
Impairment/reversal (prot or loss) - (18,681) (5,177) (23,858)
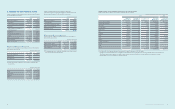
(In millions of Korean won)
Financial Liabilities Liabilities at fair value
through prot or loss
Financial liabilities
measured at
amortized cost
Other nancial
liabilities Total
Loss on valuation/disposal (prot or loss) ₩(216,236) ₩ -₩ -₩(216,236)
Interest expense 319,342 190,316 509,658
Foreign exchange differences (prot or loss) (230,212) 43,836 (186,376)
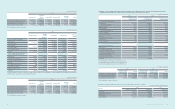
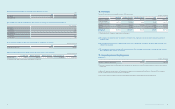
(2) As of December 31, 2012
(In millions of Korean won)
Financial Assets Assets at fair value
through prot or loss Loans and receivables Available-for-sale
nancial assets Total
Gain on valuation (other comprehensive income) ₩ -₩ -₩1,185,256 ₩1,185,256
Gain/(loss) on valuation/disposal (prot or loss) (74,609) 28,915 105,192 59,498
Gain on valuation (reclassication) - - 23,072 23,072
Interest income - 840,150 5,281 845,431
Foreign exchange differences (prot or loss) - (355,989) - (355,989)
Foreign exchange differences (other comprehensive income) - - (19,302) (19,302)
Dividend income - - 106,181 106,181
Impairment/reversal (prot or loss) - (76,231) (94,466) (170,697)
(In millions of Korean won)
Financial Liabilities Liabilities at fair value
through prot or loss
Financial liabilities
measured at
amortized cost
Other nancial
liabilities Total
Loss on valuation/disposal (prot or loss) ₩(125,553) ₩ -₩ -₩(125,553)
Interest expense - 277,512 321,494 599,006
Foreign exchange differences (prot or loss) - 17,938 43,909 61,847