Samsung 2013 Annual Report Download - page 23
Download and view the complete annual report
Please find page 23 of the 2013 Samsung annual report below. You can navigate through the pages in the report by either clicking on the pages listed below, or by using the keyword search tool below to find specific information within the annual report.-
 1
1 -
2
-
3
-
4
-
5
-
6
-
7
-
8
-
9
-
10
-
11
-
12
-
 13
13 -
 14
14 -
 15
15 -
 16
16 -
 17
17 -
 18
18 -
 19
19 -
 20
20 -
 21
21 -
 22
22 -
 23
23 -
 24
24 -
 25
25 -
 26
26 -
 27
27 -
 28
28 -
 29
29 -
 30
30 -
 31
31 -
 32
32 -
 33
33 -
34
-
35
-
36
-
37
-
38
-
39
-
40
-
41
-
42
-
43
-
44
-
45
-
46
-
47
-
48
-
49
-
50
-
51
-
52
-
53
-
54
-
55
-
56
-
57
-
58
 |
 |

42 43
2013 SAMSUNG ELECTRONICS ANNUAL REPORT
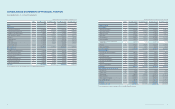
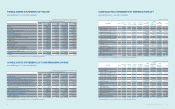
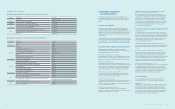
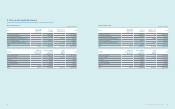
CONSOLIDATED STATEMENTS OF INCOME
Samsung Electronics Co., Ltd. and its subsidiaries
(In millions of Korean won, in thousands of US dollars (Note 2.28))
For the year ended December 31,
Notes 2013 2012 2013 2012
KRW KRW USD USD
Revenue 228,692,667 201,103,613 216,708,677 190,565,349
Cost of sales 25 137,696,309 126,651,931 130,480,725 120,015,096
Gross prot 90,996,358 74,451,682 86,227,952 70,550,253
Selling and administrative expenses 25, 26 54,211,345 45,402,344 51,370,553 43,023,163
Operating prot 36,785,013 29,049,338 34,857,399 27,527,090
Other non-operating income 27 2,429,551 1,552,989 2,302,237 1,471,609
Other non-operating expense 27 1,614,048 1,576,025 1,529,468 1,493,438
Share of prot of associates and joint ventures 12 504,063 986,611 477,649 934,910
Finance income 28 8,014,672 7,836,554 7,594,686 7,425,902
Finance costs 28 7,754,972 7,934,450 7,348,595 7,518,667
Prot before income tax 38,364,279 29,915,017 36,353,908 28,347,406
Income tax expense 29 7,889,515 6,069,732 7,476,087 5,751,665
Prot for the year 30,474,764 23,845,285 28,877,821 22,595,741
Prot attributable to owners of the parent 29,821,215 23,185,375 28,258,519 21,970,411
Prot attributable to non-controlling interests 653,549 659,910 619,302 625,330
Earnings per share for prot attributable to owners of the parent
(in Korean Won, in 1/1000 US dollars) 30
- Basic 197,841 154,020 187,474 145,949
- Diluted 197,800 153,950 187,435 145,883
The accompanying notes are an integral part of these consolidated nancial statements.
CONSOLIDATED STATEMENTS OF COMPREHENSIVE INCOME
Samsung Electronics Co., Ltd. and its subsidiaries
(In millions of Korean won, in thousands of US dollars (Note 2.28))
For the year ended December 31,
Notes 2013 2012 2013 2012
KRW KRW USD USD
Prot for the year 30,474,764 23,845,285 28,877,821 22,595,741
Other comprehensive income
Items not to be reclassied subsequently to prot or loss :
Remeasurement of net dened benet liabilities, net of tax 17, 23 (213,113) (504,120) (201,946) (477,703)
Items to be reclassied subsequently to prot or loss :
Changes in value of available-for-sale nancial assets, net of tax 23 186,480 962,184 176,708 911,763
Share of other comprehensive income (loss) of associates and
joint ventures, net of tax 23 20,756 (350,491) 19,668 (332,125)
Foreign currency translation, net of tax 23 (1,000,961) (1,824,653) (948,508) (1,729,037)
Other comprehensive loss for the year, net of tax (1,006,838) (1,717,080) (954,078) (1,627,102)
Total comprehensive income for the year 29,467,926 22,128,205 27,923,743 20,968,639
Comprehensive income attributable to :
Owners of the parent 28,837,590 21,499,343 27,326,438 20,372,732
Non-controlling interests 630,336 628,862 597,305 595,907
The accompanying notes are an integral part of these consolidated nancial statements.
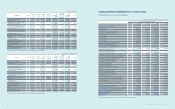
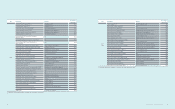
CONSOLIDATED STATEMENTS OF CHANGES IN EQUITY
Samsung Electronics Co., Ltd. and its subsidiaries
(In millions of Korean won)
2012 KRW Notes Preferred
stock
Common
stock
Share
premium
Retained
earnings
Other
components
of equity
Equity
attributable
to owners of
the parent
Non-
controlling
interests
Total
Balance at January 1, 2012 119,467 778,047 4,403,893 97,622,872 (5,833,896) 97,090,383 4,223,247 101,313,630
Prot for the year - - - 23,185,375 - 23,185,375 659,910 23,845,285
Changes in value of available-for-sale
nancial assets, net of tax 9, 23 - - - - 960,688 960,688 1,496 962,184
Share of other comprehensive loss of
associates and joint ventures, net of tax 12 - - - - (350,491) (350,491) - (350,491)
Foreign currency translation, net of tax - - - - (1,789,877) (1,789,877) (34,776) (1,824,653)
Remeasurement of net dened benet
liabilities, net of tax 17 - - - - (506,351) (506,351) 2,231 (504,120)
Total comprehensive income (loss) - - - 23,185,375 (1,686,031) 21,499,344 628,861 22,128,205
Dividends 22 - - - (827,501) - (827,501) (373,632) (1,201,133)
Capital transaction
under common control - - - - (1,089,835) (1,089,835) (104,395) (1,194,230)
Changes in consolidated entities - - - - - - 12,844 12,844
Disposal of treasury stock 23 - - - - 455,377 455,377 - 455,377
Stock option activities 24 - - - - (33,071) (33,071) - (33,071)
Others - - - 4,943 (5,588) (645) (771) (1,416)
Total transactions with owners - - - (822,558) (673,117) (1,495,675) (465,954) (1,961,629)
Balance at December 31, 2012 119,467 778,047 4,403,893 119,985,689 (8,193,044) 117,094,052 4,386,154 121,480,206
The accompanying notes are an integral part of these consolidated nancial statements.
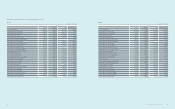
(In thousands of US dollars (Note 2.28))
2012 USD Notes Preferred
stock
Common
stock
Share
premium
Retained
earnings
Other
components
of equity
Equity
attributable
to owners of
the parent
Non-
controlling
interests
Total
Balance at January 1, 2012 113,207 737,276 4,173,119 92,507,223 (5,528,187) 92,002,638 4,001,940 96,004,578
Prot for the year - - - 21,970,411 - 21,970,411 625,330 22,595,741
Changes in value of available-for-sale
nancial assets, net of tax 9, 23 - - - - 910,345 910,345 1,418 911,763
Share of other comprehensive loss of
associates and joint ventures, net of tax 12 - - - - (332,125) (332,125) - (332,125)
Foreign currency translation, net of tax - - - - (1,696,083) (1,696,083) (32,954) (1,729,037)
Remeasurement of net dened benet
liabilities, net of tax 17 - - - - (479,816) (479,816) 2,113 (477,703)
Total comprehensive income (loss) - - - 21,970,411 (1,597,679) 20,372,732 595,907 20,968,639
Dividends 22 - - - (784,138) - (784,138) (354,053) (1,138,191)
Capital transaction
under common control - - - - (1,032,725) (1,032,725) (98,924) (1,131,649)
Changes in consolidated entities - - - - - - 12,171 12,171
Disposal of treasury stock 23 - - - - 431,514 431,514 - 431,514
Stock option activities 24 - - - - (31,338) (31,338) - (31,338)
Others - - - 4,684 (5,296) (612) (731) (1,343)
Total transactions with owners - - - (779,454) (637,845) (1,417,299) (441,537) (1,858,836)
Balance at December 31, 2012 113,207 737,276 4,173,119 113,698,180 (7,763,711) 110,958,071 4,156,310 115,114,381
The accompanying notes are an integral part of these consolidated nancial statements.