Samsung 2013 Annual Report Download - page 24
Download and view the complete annual report
Please find page 24 of the 2013 Samsung annual report below. You can navigate through the pages in the report by either clicking on the pages listed below, or by using the keyword search tool below to find specific information within the annual report.-
 1
1 -
2
-
3
-
4
-
5
-
6
-
7
-
8
-
9
-
10
-
11
-
12
-
13
-
 14
14 -
 15
15 -
 16
16 -
 17
17 -
 18
18 -
 19
19 -
 20
20 -
 21
21 -
 22
22 -
 23
23 -
 24
24 -
 25
25 -
 26
26 -
 27
27 -
 28
28 -
 29
29 -
 30
30 -
 31
31 -
 32
32 -
 33
33 -
 34
34 -
35
-
36
-
37
-
38
-
39
-
40
-
41
-
42
-
43
-
44
-
45
-
46
-
47
-
48
-
49
-
50
-
51
-
52
-
53
-
54
-
55
-
56
-
57
-
58
 |
 |
44 45
2013 SAMSUNG ELECTRONICS ANNUAL REPORT
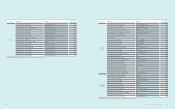
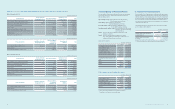
(In millions of Korean won)
2013 KRW Notes Preferred
stock
Common
stock
Share
premium
Retained
earnings
Other
components
of equity
Equity
attributable
to owners
of the parent
Non-
controlling
interests
Total
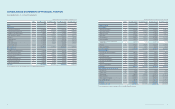
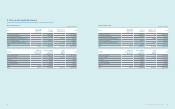
Balance at January 1, 2013 119,467 778,047 4,403,893 119,985,689 (8,193,044) 117,094,052 4,386,154 121,480,206
Prot for the year - - - 29,821,215 - 29,821,215 653,549 30,474,764
Changes in value of available-for-sale
nancial assets, net of tax 9, 23 - - - - 187,477 187,477 (997) 186,480
Share of other comprehensive
income (loss) of associates and joint
ventures, net of tax
12 - - - - 20,949 20,949 (193) 20,756
Foreign currency translation, net of tax - - - - (986,691) (986,691) (14,270) (1,000,961)
Remeasurement of net dened benet
liabilities, net of tax 17 - - - - (205,360) (205,360) (7,753) (213,113)
Total comprehensive income (loss) - - - 29,821,215 (983,625) 28,837,590 630,336 29,467,926
Dividends 22 - - - (1,206,622) - (1,206,622) (42,155) (1,248,777)
Capital transaction
under common control - - - - (312,959) (312,959) 600,042 287,083
Changes in consolidated entities - - - - - - (918) (918)
Disposal of treasury stock 23 - - - - 41,817 41,817 - 41,817
Stock option activities 24 - - - - (11,999) (11,999) - (11,999)
Others - - - - 737 737 (65) 672
Total transactions with owners - - - (1,206,622) (282,404) (1,489,026) 556,904 (932,122)
Balance at December 31, 2013 119,467 778,047 4,403,893 148,600,282 (9,459,073) 144,442,616 5,573,394 150,016,010
The accompanying notes are an integral part of these consolidated nancial statements.
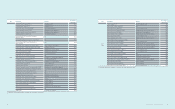
(In thousands of US dollars (Note 2.28))
2013 USD Notes Preferred
stock
Common
stock
Share
premium
Retained
earnings
Other
components
of equity
Equity
attributable
to owners
of the parent
Non-
controlling
interests
Total
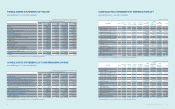
Balance at January 1, 2013 113,207 737,276 4,173,119 113,698,180 (7,763,711) 110,958,071 4,156,310 115,114,381
Prot for the year - - - 28,258,519 - 28,258,519 619,302 28,877,821
Changes in value of available-for-sale
nancial assets, net of tax 9, 23 - - - - 177,653 177,653 (945) 176,708
Share of other comprehensive
income (loss) of associates and joint
ventures, net of tax
12 - - - - 19,851 19,851 (183) 19,668
Foreign currency translation, net of tax - - - - (934,986) (934,986) (13,522) (948,508)
Remeasurement of net dened benet
liabilities, net of tax 17 - - - - (194,599) (194,599) (7,347) (201,946)
Total comprehensive income (loss) - - - 28,258,519 (932,081) 27,326,438 597,305 27,923,743
Dividends 22 - - - (1,143,392) - (1,143,392) (39,946) (1,183,338)
Capital transaction
under common control - - - - (296,559) (296,559) 568,599 272,040
Changes in consolidated entities - - - - - - (870) (870)
Disposal of treasury stock 23 - - - - 39,626 39,626 - 39,626
Stock option activities 24 - - - - (11,370) (11,370) - (11,370)
Others - - - - 697 697 (62) 635
Total transactions with owners - - - (1,143,392) (267,606) (1,410,998) 527,721 (883,277)
Balance at December 31, 2013 113,207 737,276 4,173,119 140,813,307 (8,963,398) 136,873,511 5,281,336 142,154,847
The accompanying notes are an integral part of these consolidated nancial statements.
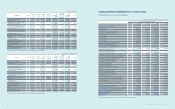
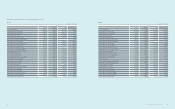
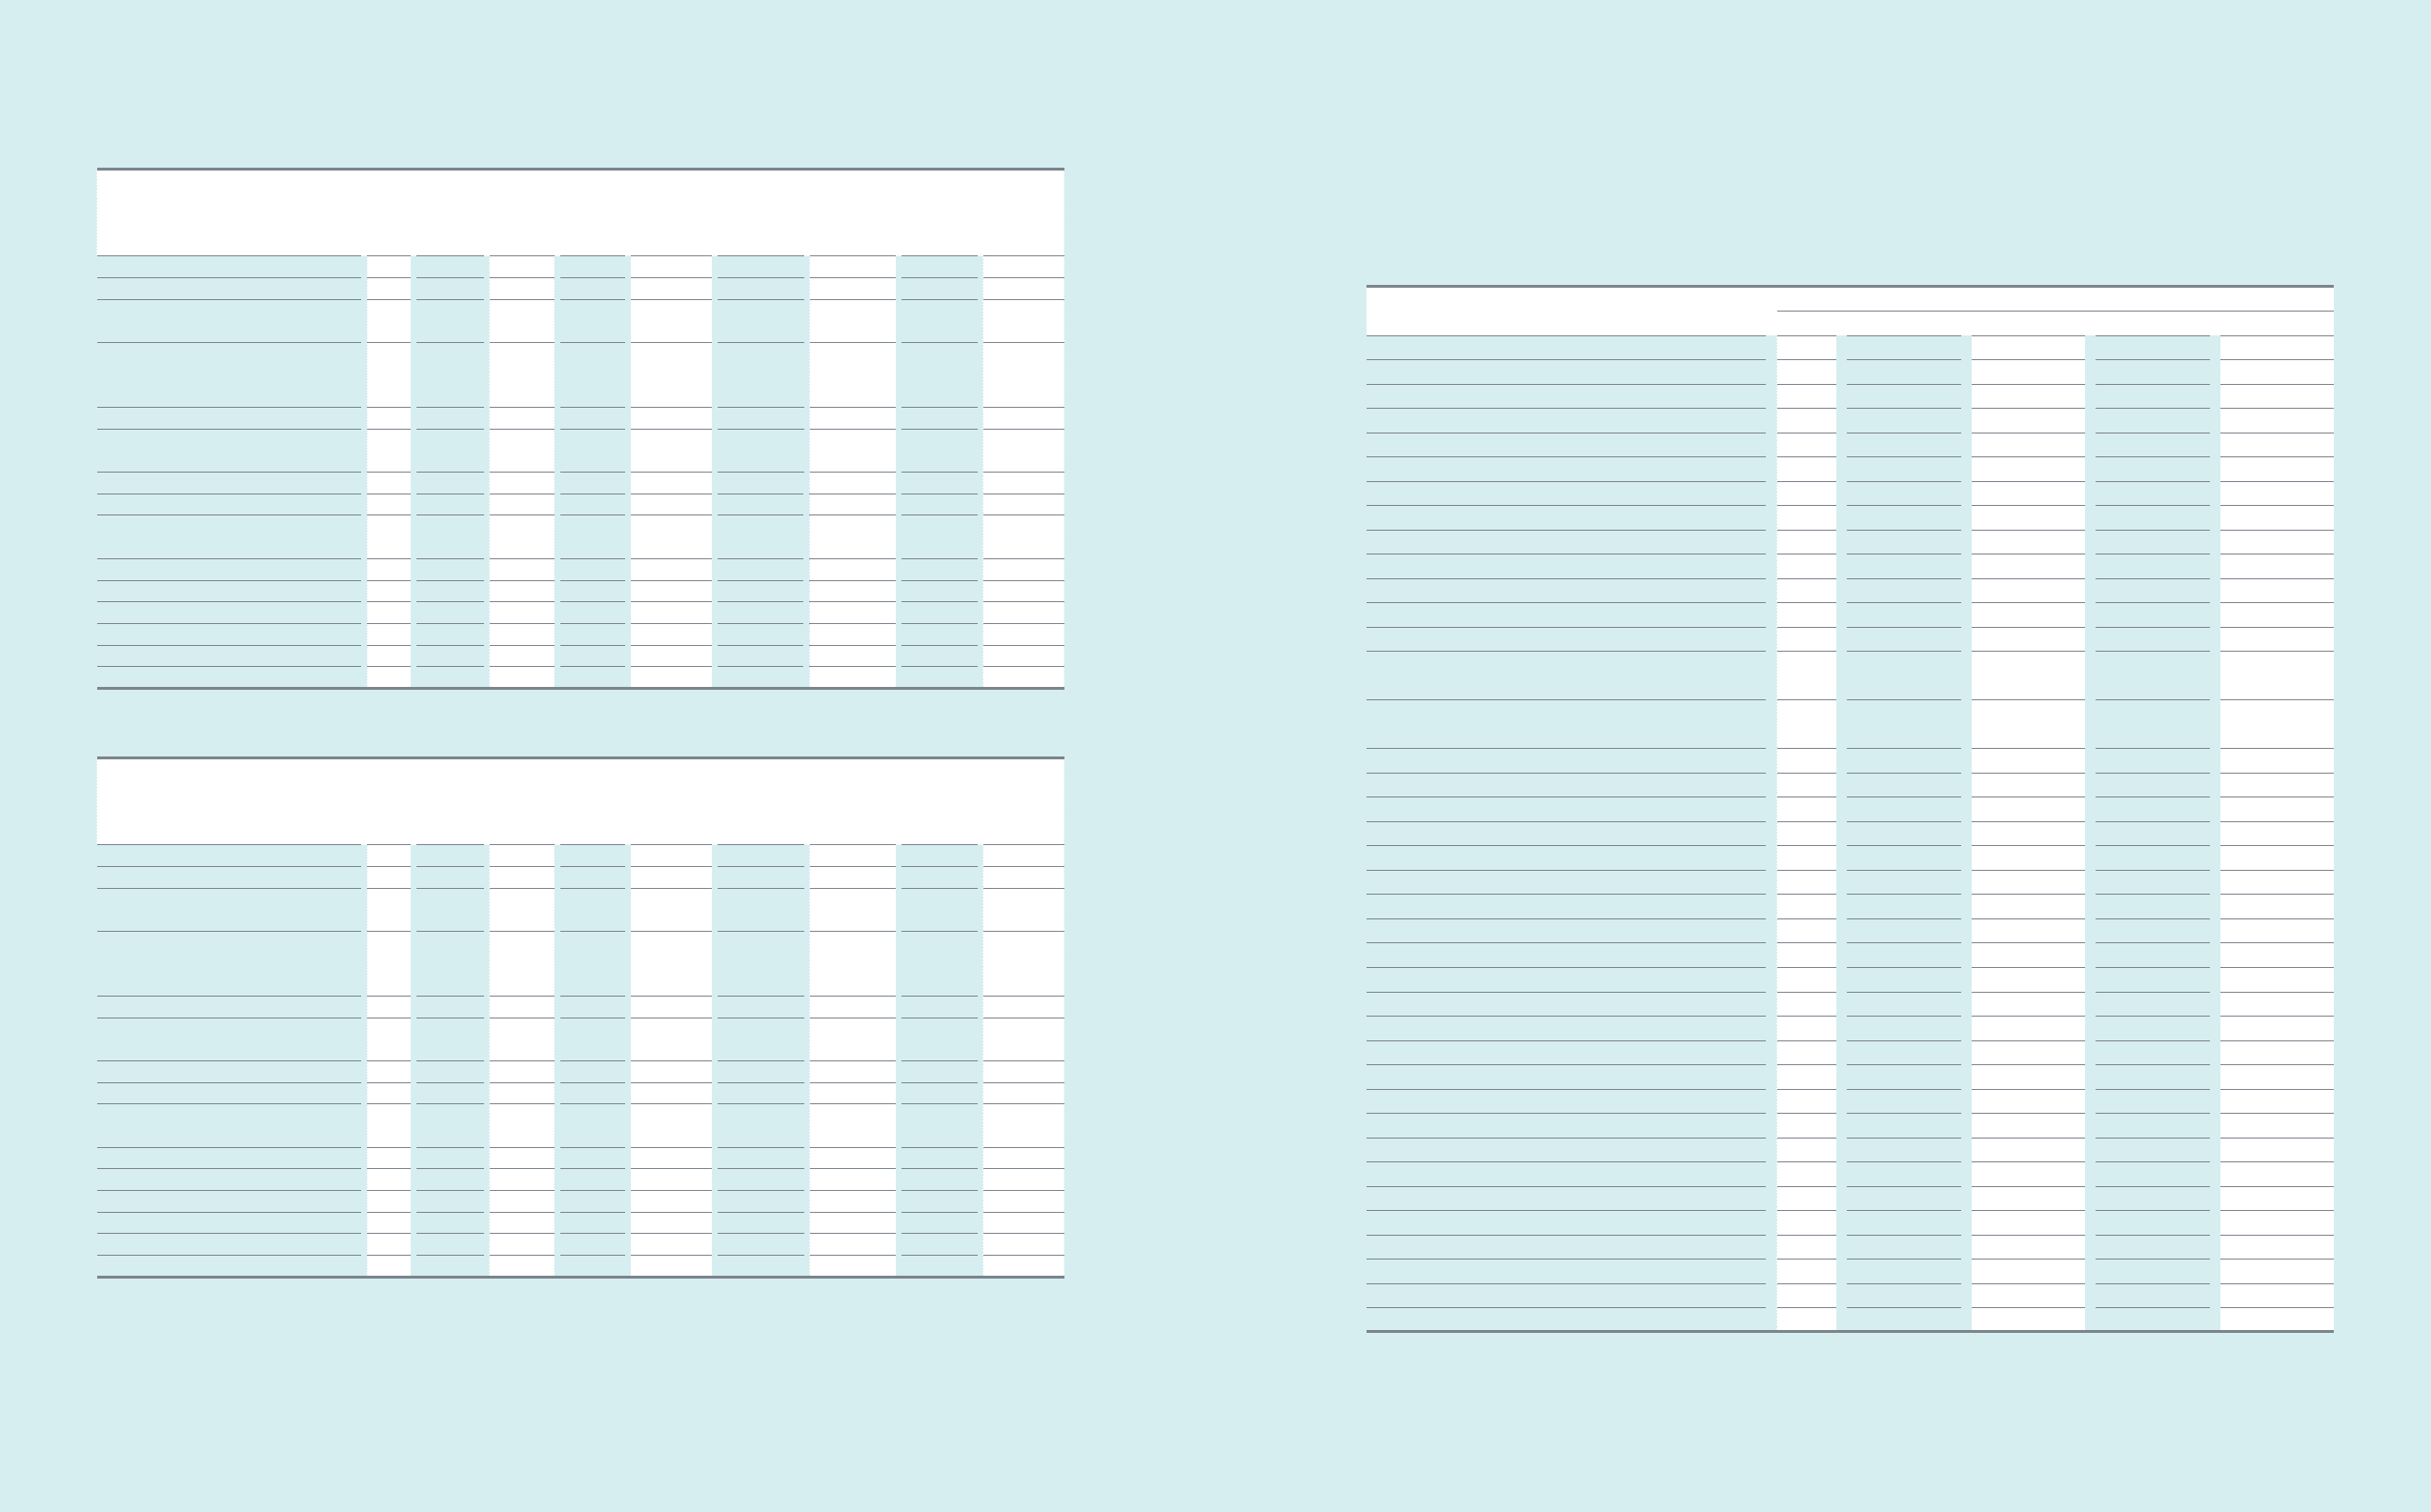
CONSOLIDATED STATEMENTS OF CASH FLOWS
Samsung Electronics Co., Ltd. and its subsidiaries
(In millions of Korean won, in thousands of US dollars (Note 2.28))
For the year ended December 31,
Notes 2013 2012 2013 2012
KRW KRW USD USD
Cash ows from operating activities
Prot for the year 30,474,764 23,845,285 28,877,821 22,595,741
Adjustments 31 23,804,832 22,759,559 22,557,407 21,566,909
Changes in operating assets and liabilities 31 (1,313,245) (5,777,949) (1,244,428) (5,475,173)
Cash ows from operating activities 52,966,351 40,826,895 50,190,800 38,687,477
Interest received 1,034,074 789,397 979,886 748,031
Interest paid (434,857) (576,379) (412,070) (546,175)
Dividend received 592,217 1,112,940 561,184 1,054,620
Income tax paid (7,450,345) (4,180,044) (7,059,931) (3,961,001)
Net cash generated from operating activities 46,707,440 37,972,809 44,259,869 35,982,952
Cash ows from investing activities
Net increase in short-term nancial instruments (19,391,643) (5,965,611) (18,375,479) (5,653,000)
Net decrease (increase) in short-term
available-for-sale nancial assets 33,663 (589,072) 31,899 (558,203)
Proceeds from disposal of long-term
available-for-sale nancial assets 1,691,463 106,208 1,602,827 100,642
Acquisition of long-term available-for-sale nancial assets (1,531,356) (870,249) (1,451,110) (824,646)
Proceeds from disposal of associates and joint ventures 240 41,091 227 38,938
Acquisition of associates and joint ventures (181,307) (279,022) (171,806) (264,401)
Disposal of property and equipment 377,445 644,062 357,666 610,312
Purchases of property and equipment (23,157,587) (22,965,271) (21,944,079) (21,761,841)
Disposal of intangible assets 4,562 61,497 4,323 58,274
Purchases of intangible assets (934,743) (650,884) (885,760) (616,776)
Cash outows from business combination (167,155) (464,279) (158,396) (439,950)
Others (1,490,601) (390,024) (1,412,491) (369,586)
Net cash used in investing activities (44,747,019) (31,321,554) (42,402,179) (29,680,237)
Cash ows from nancing activities
Net repayment of short-term borrowings (1,861,536) (800,579) (1,763,987) (758,627)
Disposal of treasury stock 34,390 88,473 32,588 83,837
Proceeds from long-term borrowings and debentures 26,672 1,862,256 25,274 1,764,670
Repayment of long-term borrowings and debentures (1,368,436) (522,899) (1,296,727) (495,498)
Payment of dividends (1,249,672) (1,265,137) (1,184,186) (1,198,841)
Net increase (decrease) in non-controlling interests 281,551 (1,200,134) 266,797 (1,137,244)
Others - (26,488) - (25,101)
Net cash used in nancing activities (4,137,031) (1,864,508) (3,920,241) (1,766,804)
Effect of exchange rate changes on cash and cash equivalents (330,070) (687,048) (312,774) (651,045)
Net increase (decrease) in cash and cash equivalents (2,506,680) 4,099,699 (2,375,325) 3,884,866
Cash and cash equivalents
Beginning of the year 18,791,460 14,691,761 17,806,747 13,921,881
End of the year 16,284,780 18,791,460 15,431,422 17,806,747
The accompanying notes are an integral part of these consolidated nancial statements.