Samsung 2013 Annual Report Download - page 38
Download and view the complete annual report
Please find page 38 of the 2013 Samsung annual report below. You can navigate through the pages in the report by either clicking on the pages listed below, or by using the keyword search tool below to find specific information within the annual report.-
 1
1 -
2
-
3
-
4
-
5
-
6
-
7
-
8
-
9
-
10
-
11
-
12
-
13
-
14
-
15
-
16
-
17
-
18
-
19
-
20
-
21
-
22
-
23
-
24
-
25
-
26
-
27
-
 28
28 -
 29
29 -
 30
30 -
 31
31 -
 32
32 -
 33
33 -
 34
34 -
 35
35 -
 36
36 -
 37
37 -
 38
38 -
 39
39 -
 40
40 -
 41
41 -
 42
42 -
 43
43 -
 44
44 -
 45
45 -
 46
46 -
 47
47 -
 48
48 -
49
-
50
-
51
-
52
-
53
-
54
-
55
-
56
-
57
-
58
 |
 |
72 73
2013 SAMSUNG ELECTRONICS ANNUAL REPORT
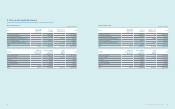
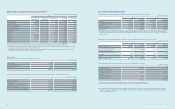
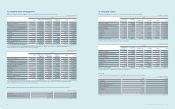
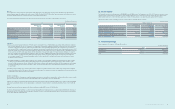
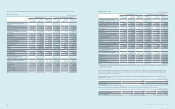
(2) Investments in joint ventures
(In millions of Korean won)
Investee
2013
Acquisition cost Net asset value of equity shares (*) Book value
Samsung Corning Precision Materials ₩ -₩ -₩ -
Samsung Corning Advanced Glass 115,000 111,961 111,961
Others 422,995 (16,357) 9,368
Total ₩537,995 ₩95,604 ₩121,329
(In millions of Korean won)
Investee
2012
Acquisition cost Net asset value of equity shares (*) Book value
Samsung Corning Precision Materials ₩297,165 ₩2,825,104 ₩2,794,617
Samsung Corning Advanced Glass 115,000 114,274 114,274
Others 419,461 64,193 54,319
Total ₩831,626 ₩3,003,571 ₩2,963,210
(*) Company’s portion of net asset value of associates based on the Company’s ownership percentage.
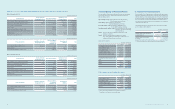
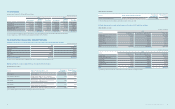
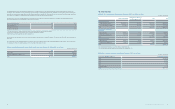
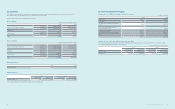
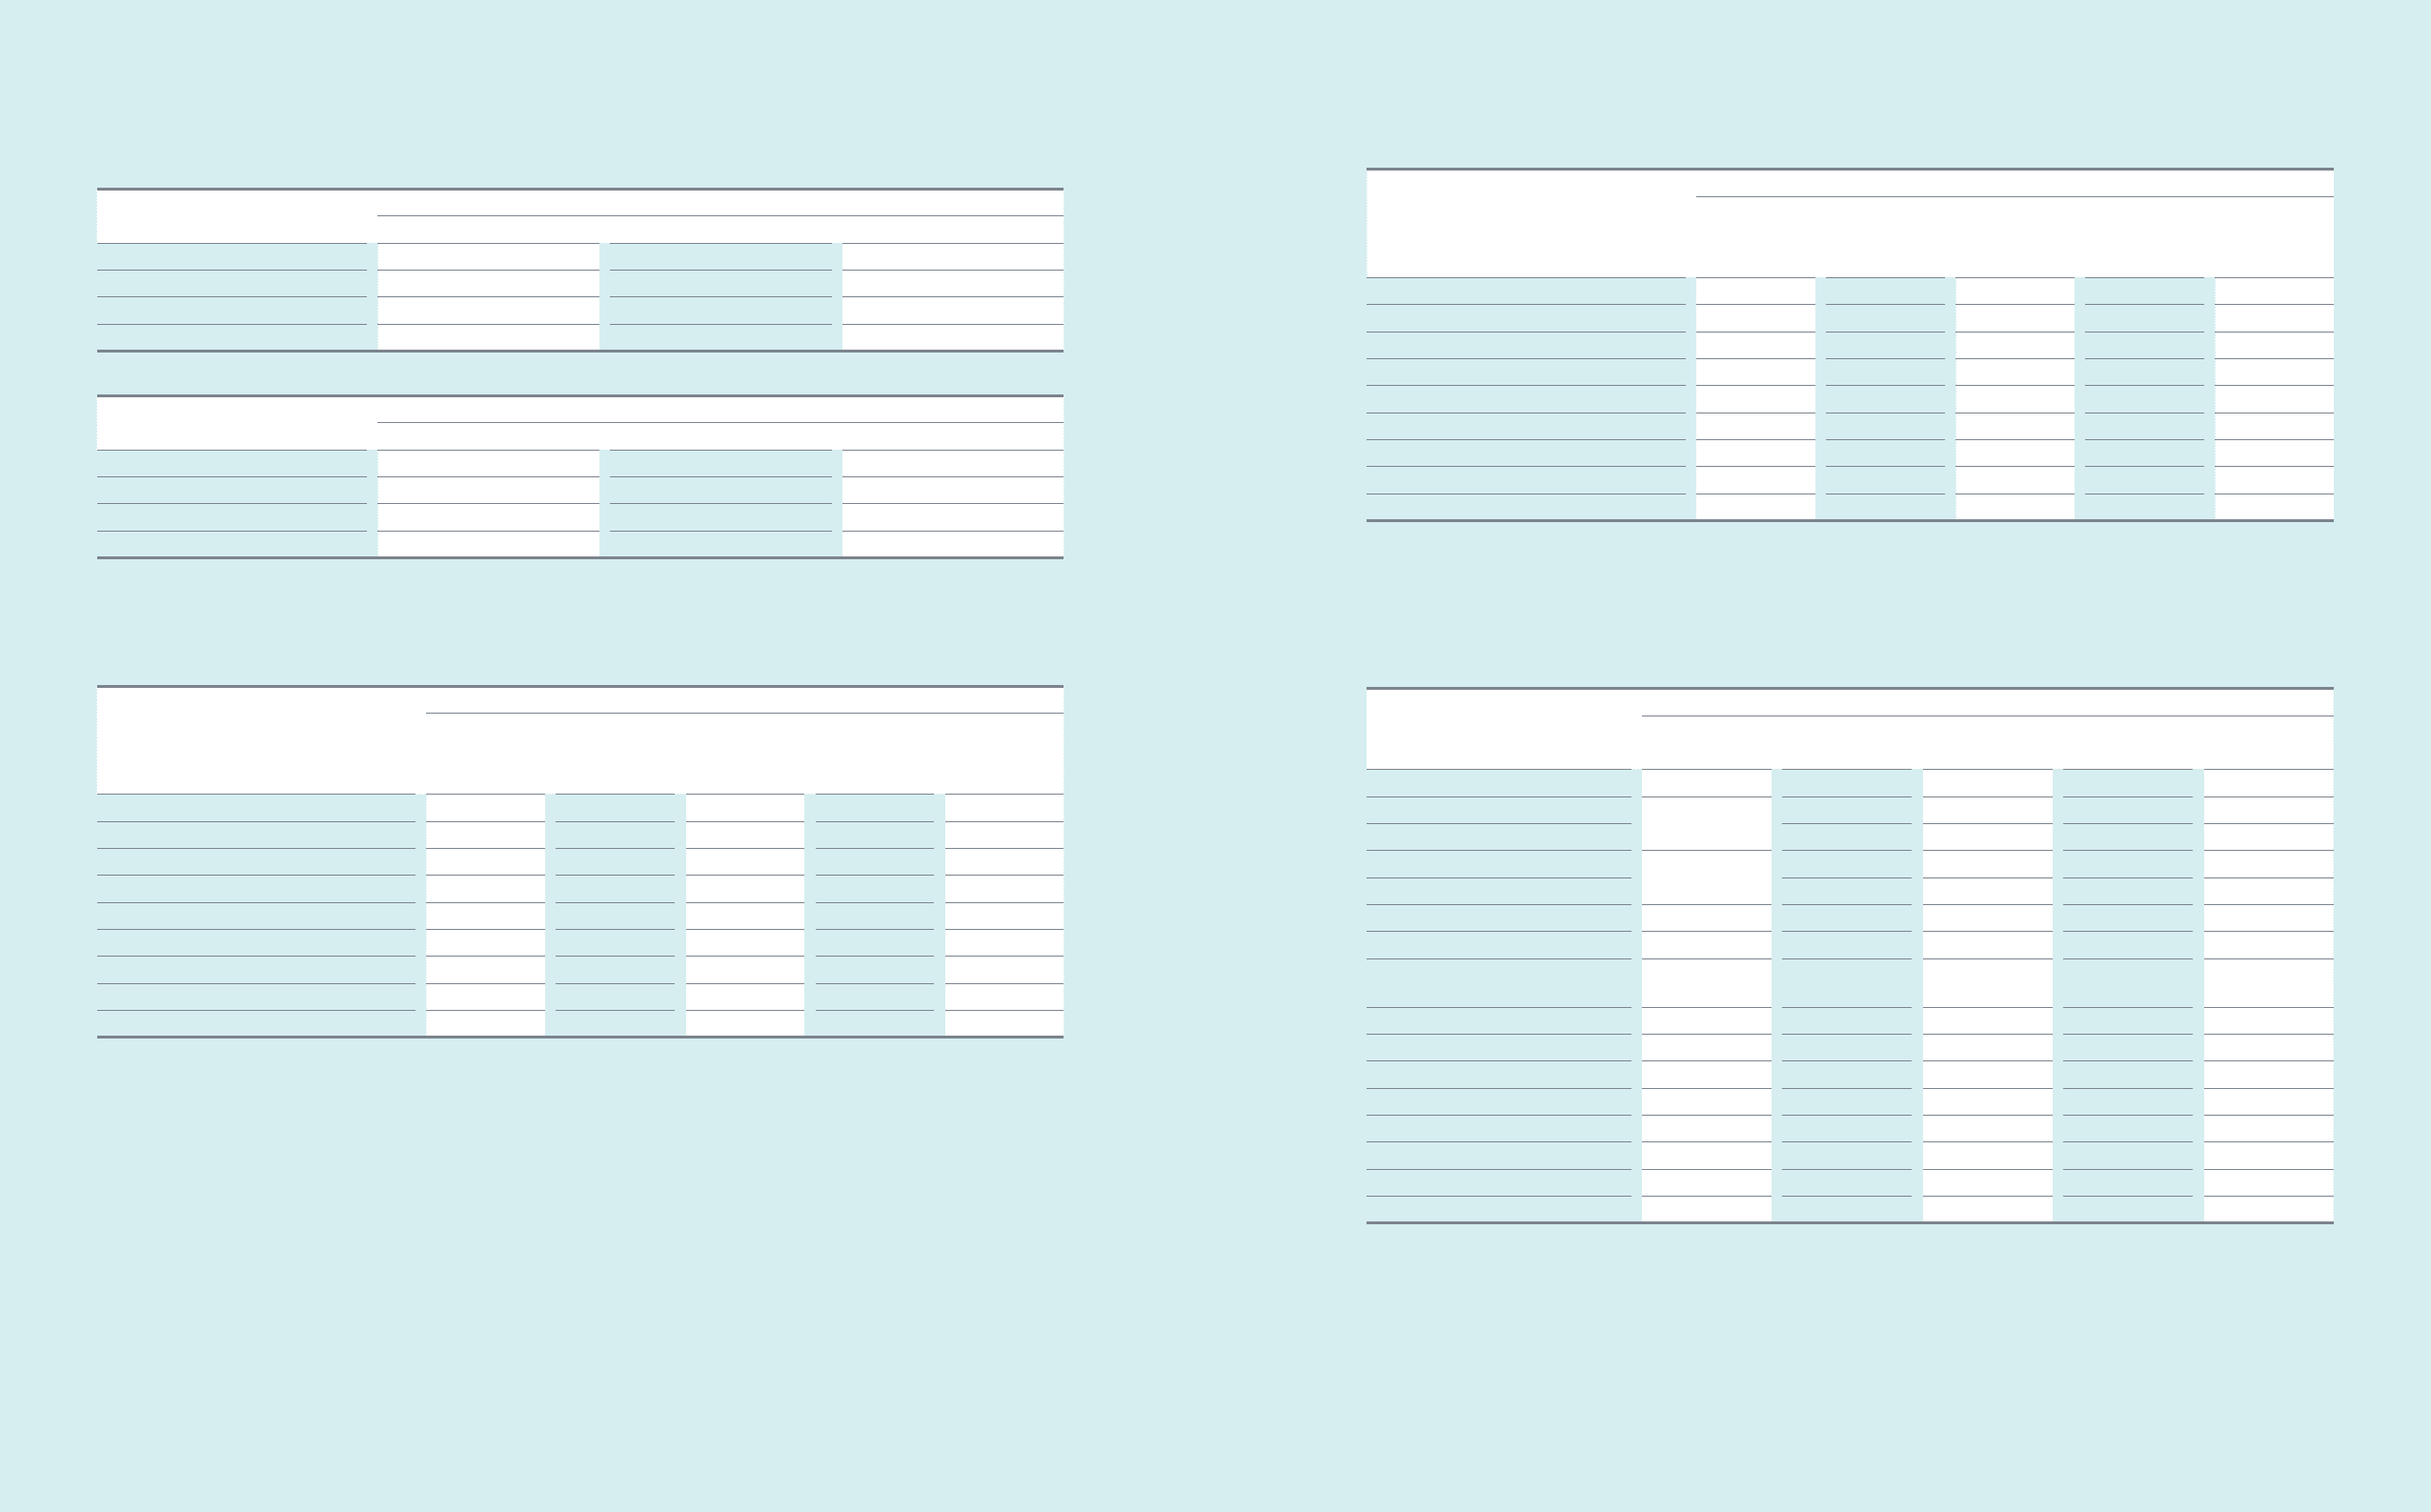
(D) Details of valuation of investments in associates and joint ventures under the equity method for the years ended December 31, 2013 and 2012,
are as follows:
(In millions of Korean won)
Investee
2013
Balance as of
January 1
Gain/loss
on valuation
Other
comprehensive
income/loss
Others (*1) Balance as of
December 31
Samsung Card ₩2,238,073 ₩102,361 ₩29,828 ₩(30,253) ₩2,340,009
Samsung Electro-Mechanics 890,460 75,565 6,354 (17,883) 954,496
Samsung SDI 1,174,183 25,760 (10,310) (14,429) 1,175,204
Samsung SDS 701,808 69,739 (17,838) 126,247 879,956
Samsung Techwin 360,739 39,554 9,021 (6,569) 402,745
Samsung Corning Precision Materials (*2) 2,794,617 347,981 (1,247) (3,141,351) -
Samsung Corning Advanced Glass 114,274 (2,302) (11) - 111,961
Others 511,335 (154,595) 4,959 196,222 557,921
Total ₩8,785,489 ₩504,063 ₩20,756 ₩(2,888,016) ₩6,422,292
(*1) Others consist of acquisitions, disposals, dividends, and effects of changes in foreign exchange rates, etc.
(*2) During the year ended December 31, 2013, the Company signed a framework agreement for comprehensive business cooperation with Corning Incorporated
and its related parties. As of December 31, 2013, the Company classied its share in Samsung Corning Precision Materials Co., Ltd (ownership percentage:
42.54%) as assets held-for-sale, and disposed of such shares for USD 1,902 million on January 15, 2014. Under the agreement, the Company will receive
additional dividends after the resolution of shareholders’ meeting.
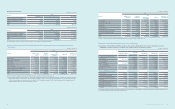
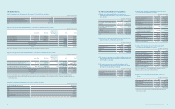
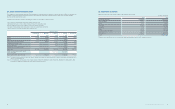
(In millions of Korean won)
Investee
2012
Balance as of
January 1
Gain/loss
on valuation
Other
comprehensive
income/loss
Others (*) Balance as of
December 31
Samsung Card ₩2,184,855 ₩264,688 ₩(181,217) ₩(30,253) ₩2,238,073
Samsung Electro-Mechanics 799,792 102,946 11,689 (23,967) 890,460
Samsung SDI 1,185,509 31,256 (30,531) (12,051) 1,174,183
Samsung SDS 632,593 89,157 (16,488) (3,454) 701,808
Samsung Techwin 370,379 39,356 (27,171) (21,825) 360,739
Samsung Corning Precision Materials 3,089,298 644,242 (10,300) (928,623) 2,794,617
Samsung Corning Advanced Glass - (726) - 115,000 114,274
Others 941,743 (184,308) (96,473) (149,627) 511,335
Total ₩9,204,169 ₩986,611 ₩(350,491) ₩(1,054,800) ₩8,785,489
(*) Others consist of acquisitions, disposals, dividends, and effects of changes in foreign exchange rates, etc.
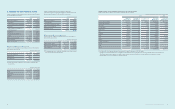
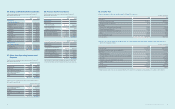
(E) Summary of condensed nancial information of major associates and joint ventures.
(1) A summary of condensed nancial information of major associates, details of adjustments from the book value of investments in associates,
and dividends received from associates as of and for the years ended December 31, 2013 and 2012, is as follows:
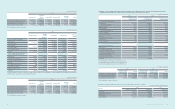
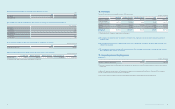
(In millions of Korean won)
2013
Samsung Card (*1) Samsung
Electro-Mechanics Samsung SDI Samsung SDS Samsung Techwin
1. Condensed nancial information
Current assets
₩16,560,926
₩2,650,765 ₩2,063,192 ₩2,928,998 ₩1,561,706
Non-current assets 4,534,578 8,492,479 2,371,102 1,872,518
Current liabilities
10,358,265
1,787,432 1,526,957 1,219,484 1,169,253
Non-current liabilities 1,139,884 1,486,297 197,222 560,191
Non-controlling interests - 83,966 164,323 80,644 1,628
Revenue 2,847,053 8,256,579 5,016,465 7,046,833 2,912,031
2. Details of adjustments from the book
value of investments in associates
Net assets (a) 6,202,661 4,174,061 7,378,094 3,802,750 1,703,152
Ownership percentage (*2)(b) 37.5% 22.8% 19.7% 22.6% 25.5%
Net assets of equity shares (a x b) 2,322,897 951,693 1,451,770 858,671 433,624
Goodwill 17,181 - - 26,801 -
Intercompany transactions, etc. (69) 2,803 (276,566) (5,516) (30,879)
Book value of associates 2,340,009 954,496 1,175,204 879,956 402,745
3. Dividends from associates
Dividends ₩30,375 ₩17,693 ₩13,924 ₩3,914 ₩6,763
(*1) Samsung Card does not present current and non-current assets, and current and non-current liabilities, as separate classications in its statement of nancial position.
(*2) Ownership percentage includes common and preferred stocks.