Samsung 2013 Annual Report Download - page 33
Download and view the complete annual report
Please find page 33 of the 2013 Samsung annual report below. You can navigate through the pages in the report by either clicking on the pages listed below, or by using the keyword search tool below to find specific information within the annual report.-
 1
1 -
2
-
3
-
4
-
5
-
6
-
7
-
8
-
9
-
10
-
11
-
12
-
13
-
14
-
15
-
16
-
17
-
18
-
19
-
20
-
21
-
22
-
 23
23 -
 24
24 -
 25
25 -
 26
26 -
 27
27 -
 28
28 -
 29
29 -
 30
30 -
 31
31 -
 32
32 -
 33
33 -
 34
34 -
 35
35 -
 36
36 -
 37
37 -
 38
38 -
 39
39 -
 40
40 -
 41
41 -
 42
42 -
 43
43 -
44
-
45
-
46
-
47
-
48
-
49
-
50
-
51
-
52
-
53
-
54
-
55
-
56
-
57
-
58
 |
 |
62 63
2013 SAMSUNG ELECTRONICS ANNUAL REPORT
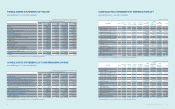
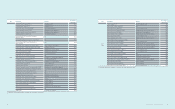
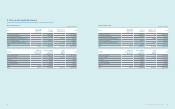
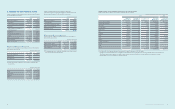
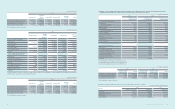
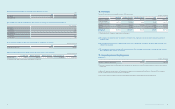
6. Financial Instruments by Category
(A) Categorizations of nancial assets and liabilities as of December 31, 2013 and 2012, are as follows:
(1) As of December 31, 2013
(In millions of Korean won)
Assets
Assets at fair
value through
prot or loss
Loans and
receivables
Available-for-sale
nancial assets Total
Cash and cash equivalents ₩ -₩16,284,780 ₩ -₩16,284,780
Short-term nancial instruments - 36,722,702 - 36,722,702
Short-term available-for-sale nancial assets - - 1,488,527 1,488,527
Trade and other receivables - 24,988,532 - 24,988,532
Long-term available-for-sale nancial assets - - 6,238,380 6,238,380
Others 40,552 5,432,404 - 5,472,956
Total ₩40,552 ₩83,428,418 ₩7,726,907 ₩91,195,877
Liabilities
Liabilities at
fair value through
prot or loss
Financial liabilities
measured at
amortized cost
Other
nancial
liabilities
Total
Trade and other payables ₩ -₩16,314,720 ₩ -₩16,314,720
Short-term borrowings - 3,181,582 3,256,935 6,438,517
Debentures - 1,311,068 - 1,311,068
Long-term borrowings - 985,117 - 985,117
Long-term other payables - 1,023,714 - 1,023,714
Others 244,172 13,044,171 - 13,288,343
Total ₩244,172 ₩35,860,372 ₩3,256,935 ₩39,361,479
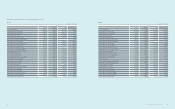
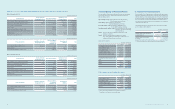
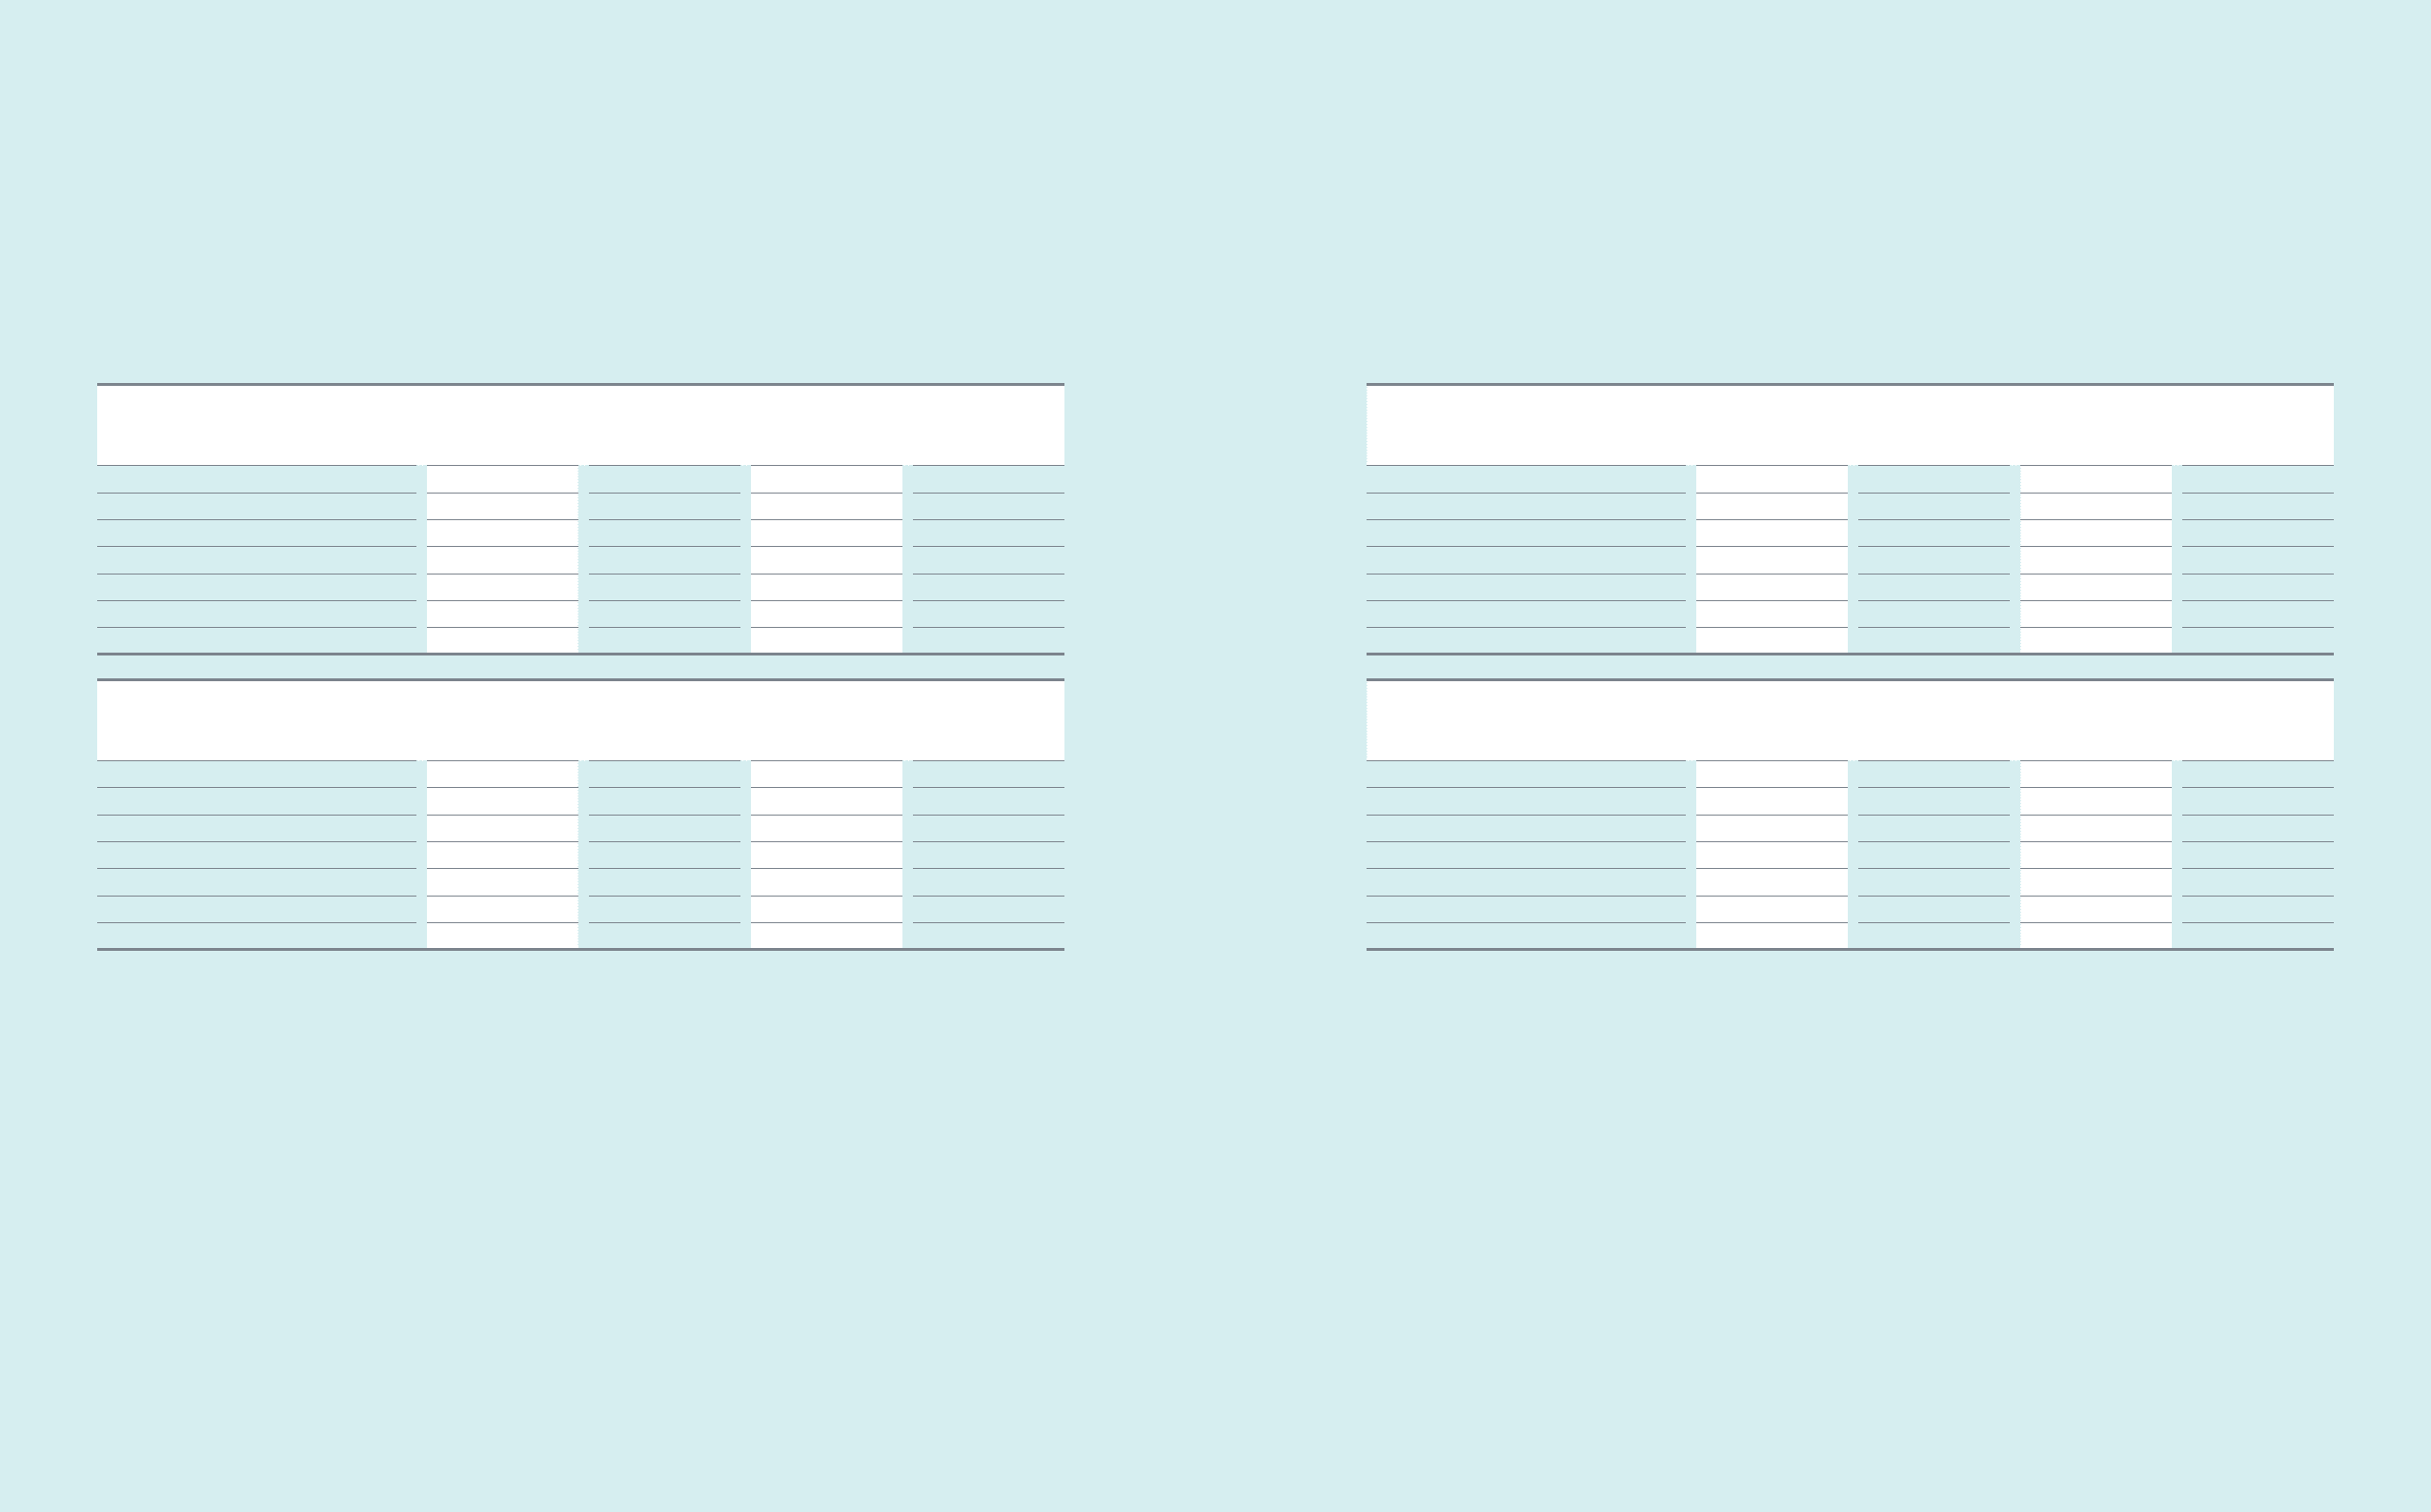
(2) As of December 31, 2012
(In millions of Korean won)
Assets
Assets at fair
value through
prot or loss
Loans and
receivables
Available-for-sale
nancial assets Total
Cash and cash equivalents ₩ -₩18,791,460 ₩ -₩18,791,460
Short-term nancial instruments - 17,397,937 - 17,397,937
Short-term available-for-sale nancial assets - - 1,258,874 1,258,874
Trade and other receivables - 23,861,235 - 23,861,235
Long-term available-for-sale nancial assets - - 5,229,175 5,229,175
Others 47,227 5,685,042 - 5,732,269
Total ₩47,227 ₩65,735,674 ₩6,488,049 ₩72,270,950
Liabilities
Liabilities at
fair value through
prot or loss
Financial liabilities
measured at
amortized cost
Other
nancial
liabilities
Total
Trade and other payables ₩ -₩16,889,350 ₩ -₩16,889,350
Short-term borrowings - 4,115,249 4,328,503 8,443,752
Debentures - 1,829,374 - 1,829,374
Long-term borrowings - 3,623,028 - 3,623,028
Long-term other payables - 1,165,881 - 1,165,881
Others 79,212 10,788,823 - 10,868,035
Total ₩79,212 ₩38,411,705 ₩4,328,503 ₩42,819,420