Samsung 2013 Annual Report Download - page 49
Download and view the complete annual report
Please find page 49 of the 2013 Samsung annual report below. You can navigate through the pages in the report by either clicking on the pages listed below, or by using the keyword search tool below to find specific information within the annual report.-
 1
1 -
2
-
3
-
4
-
5
-
6
-
7
-
8
-
9
-
10
-
11
-
12
-
13
-
14
-
15
-
16
-
17
-
18
-
19
-
20
-
21
-
22
-
23
-
24
-
25
-
26
-
27
-
28
-
29
-
30
-
31
-
32
-
33
-
34
-
35
-
36
-
37
-
38
-
 39
39 -
 40
40 -
 41
41 -
 42
42 -
 43
43 -
 44
44 -
 45
45 -
 46
46 -
 47
47 -
 48
48 -
 49
49 -
 50
50 -
 51
51 -
 52
52 -
 53
53 -
 54
54 -
 55
55 -
 56
56 -
 57
57 -
 58
58
 |
 |

94 95
2013 SAMSUNG ELECTRONICS ANNUAL REPORT
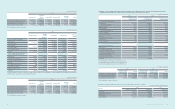
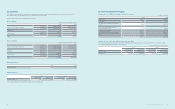
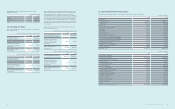
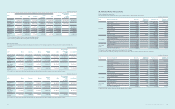
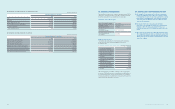
31. Cash Generated from Operations
(A) Cash ows from operating activities as of December 31, 2013 and 2012, consist of the following:
(In millions of Korean won)
2013 2012
Adjustments for:
Income tax expense ₩7,889,515 ₩6,069,732
Finance income (2,551,623) (2,068,888)
Finance costs 1,568,663 1,755,715
Severance and retirement benets 971,997 768,423
Depreciation 15,470,012 14,835,046
Amortization 975,401 786,970
Bad debt expenses, etc. 282,978 205,424
Gain on valuation of equity method (504,063) (986,611)
Gain on disposal of property, plant and equipment (110,638) (147,645)
Loss on disposal of property, plant and equipment 187,863 324,993
Obsolescence and scrapping of inventories, etc. 1,045,360 1,212,222
Gain on disposal of investments (1,117,029) (112,505)
Impairment losses on intangible assets 108,420 216,790
Other income/expense (412,024) (100,107)
Adjustments, total ₩23,804,832 ₩22,759,559
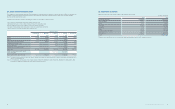
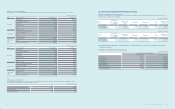
(In millions of Korean won)
2013 2012
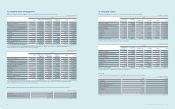
Changes in assets and liabilities:
Increase in trade receivables ₩(1,993,705) ₩(2,032,126)
Decrease/(increase) in other receivables 192,054 (536,202)
Increase in advances (144,720) (277,329)
Increase in prepaid expenses (321,953) (72,285)
Increase in inventories (3,097,762) (4,011,553)
Decrease in trade payables (965,677) (465,450)
Increase/(decrease) in other payables 1,296,263 (416,870)
Increase in advances received 49,495 88,152
Increase/(decrease) in withholdings 323,874 (663,733)
Increase in accrued expenses 2,261,910 2,183,846
Increase in provisions 2,009,248 1,824,693
Payment of severance benets (244,186) (301,444)
Increase in plan assets (837,296) (440,420)
Others 159,210 (657,228)
Changes in net working capital, total ₩(1,313,245) ₩(5,777,949)
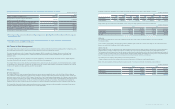
(D) The liquidity analysis of deferred tax assets and deferred tax
liabilities is as follows:
(In millions of Korean won)
2013 2012
Current ₩(107,699) ₩1,898,481
Non-current (1,282,892) (2,811,868)
Total ₩(1,390,591) ₩(913,387)
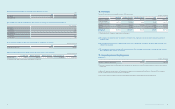
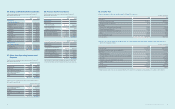
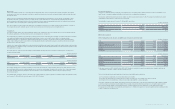
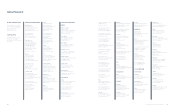
30. Earnings per Share
Basic earnings per share for the years ended December 31, 2013 and 2012,
are calculated as follows:
(In millions of Korean won and thousands of number of shares)
2013 2012
Net income as reported on
the statements of income ₩29,821,215 ₩23,185,375
Net income available for common stock 25,893,396 20,130,020
Weighted-average number of
common shares outstanding
(in thousands)
130,880 130,698
Basic earnings per share
(in Korean won) ₩197,841 ₩154,020
(In millions of Korean won and thousands of number of shares)
2013 2012
Net income as reported on
the statements of income ₩29,821,215 ₩23,185,375
Net income available for preferred stock 3,927,819 3,055,355
Weighted-average number of
preferred shares outstanding
(in thousands)
19,854 19,854
Basic earnings per preferred share
(in Korean won) ₩197,838 ₩153,893
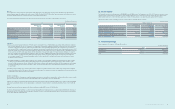
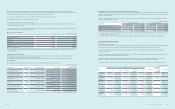
Diluted earnings per share is calculated by adjusting the weighted average
number of ordinary shares outstanding to assume conversion of all dilutive
potential ordinary shares. The Company has one category of dilutive
potential ordinary shares: stock options. A calculation is done to determine
the number of shares that could have been acquired at fair value (determined
as the average annual market share price of the Company’s shares) based
on the monetary value of the subscription rights attached to outstanding
share options. The number of shares calculated as above is compared with
the number of shares that would have been issued assuming the exercise of
the share options.
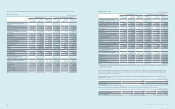
Diluted earnings per share for the years ended December 31, 2013 and
2012, are calculated as follows:
(In millions of Korean won and thousands of number of shares)
2013 2012
Net income available for common
stock and common stock equivalents ₩25,894,151 ₩20,131,405
Weighted-average number of
shares of common stock and
common stock equivalents
(in thousands)
130,911 130,766
Diluted earnings per share
(in Korean won) ₩197,800 ₩153,950
(In millions of Korean won and thousands of number of shares)
2013 2012
Net income available for preferred
stock and preferred stock equivalents ₩3,927,064 ₩3,053,970
Weighted-average number of
shares of preferred stock and
preferred stock equivalents
(in thousands)
19,854 19,854
Diluted earnings per preferred share
(in Korean won) ₩197,800 ₩153,823