Samsung 2013 Annual Report Download - page 52
Download and view the complete annual report
Please find page 52 of the 2013 Samsung annual report below. You can navigate through the pages in the report by either clicking on the pages listed below, or by using the keyword search tool below to find specific information within the annual report.-
 1
1 -
2
-
3
-
4
-
5
-
6
-
7
-
8
-
9
-
10
-
11
-
12
-
13
-
14
-
15
-
16
-
17
-
18
-
19
-
20
-
21
-
22
-
23
-
24
-
25
-
26
-
27
-
28
-
29
-
30
-
31
-
32
-
33
-
34
-
35
-
36
-
37
-
38
-
39
-
40
-
41
-
 42
42 -
 43
43 -
 44
44 -
 45
45 -
 46
46 -
 47
47 -
 48
48 -
 49
49 -
 50
50 -
 51
51 -
 52
52 -
 53
53 -
 54
54 -
 55
55 -
 56
56 -
 57
57 -
 58
58
 |
 |

100 101
2013 SAMSUNG ELECTRONICS ANNUAL REPORT
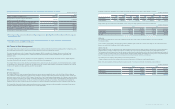
The fair value of nancial instruments that are not traded in an active market (for example, over-the-counter derivatives) is determined by using valuation
techniques. These valuation techniques maximize the use of observable market data where it is available and rely as little as possible on entity specic estimates.
If all signicant inputs required to fair value an instrument are observable, the instrument is included in Level 2.
If one or more of the signicant inputs is not based on observable market data, the instrument is included in Level 3.
Specic valuation techniques used to value nancial instruments include:
· Quoted market prices or dealer quotes for similar instruments.
· The fair value of forward foreign exchange contracts is determined using forward exchange rates at the statement of nancial position date, with the resulting
value discounted back to present value.
Other techniques, such as discounted cash ow analysis, are used to determine fair value for the remaining nancial instruments. For trade and other receivables,
the book value approximates a reasonable estimate of fair value.
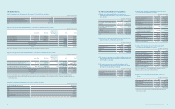
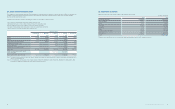
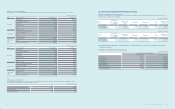
(2) Changes in Level 3 instruments:
(In millions of Korean won)
2013 2012
Balance as of January 1 ₩389,195 ₩623,739
Purchases 151,741 82,508
Disposals, etc. (46,357) (31,972)
Gains and losses recognized in other comprehensive income 2,615 (6,294)
Others (*) (3,816) (278,786)
Balance as of December 31 ₩493,378 ₩389,195
(*) Amount measured at cost is included as the range of reasonable fair value estimates is signicant and the probabilities of the various estimates cannot be
reasonably assessed.
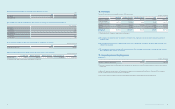
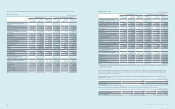
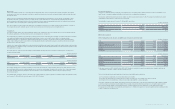
(3) Valuation technique and the inputs
The Company utilizes a present value technique to discount future cash ows at a proper interest rate for corporate bonds, government and public bonds,
and bank debentures that are classied as Level 2 in the fair value hierarchy.
The Company uses a binomial pricing model derived from the assumption that the underlying assets for the currency forward contracts follow a binomial
probability distribution.
The following table presents the valuation technique and the inputs used for major nancial instruments classied as Level 3.
(In millions of Korean won)
Classication Fair value Valuation Technique Level 3 Inputs Input Range
(Weighted Average)
Samsung Petrochemical 80,347 Discounted cash ow
Permanent growth rate -1.00%~1.00% (0%)
Weighted average cost of capital 6.37%~8.37% (7.37%)
Samsung General Chemicals 80,653 Discounted cash ow
Permanent growth rate -1.00%~1.00% (0%)
Weighted average cost of capital 7.01%~9.01% (8.01%)
Taewon Electric 17,072 Discounted cash ow
Permanent growth rate -1.00%~1.00% (0%)
Weighted average cost of capital 6.06%~8.06% (7.06%)
Pantech 53,053 Discounted cash ow
Permanent growth rate -1.00%~1.00% (0%)
Weighted average cost of capital 8.81%~10.81% (9.81%)
Samsung Venture Investment 7,021 Discounted cash ow
Permanent growth rate -1.00%~1.00% (0%)
Weighted average cost of capital 7.69%~9.69% (8.69%)
Embedded derivatives
(convertible bonds, etc.) 13,240 Binomial model
Discount rate 6.81%~12.96% (8.34%)
Stock price volatility 13.77%~20.02% (17.15%)
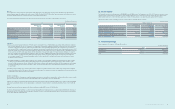
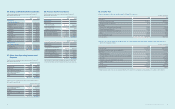
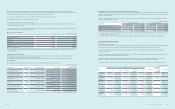
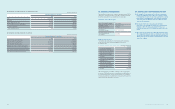
(4) Sensitivity analysis for recurring fair value measurements categorized within Level 3
Sensitivity analysis of nancial instruments is performed to measure favorable and unfavorable changes in the fair value of nancial instruments which are affected
by the unobservable parameters, using a statistical technique. When the fair value is affected by more than two input parameters, the amounts represent the most
favorable or most unfavorable.
The results of the sensitivity analysis for the effect on prot or loss from changes in inputs for each nancial instrument, which is categorized within Level 3 and
subject to sensitivity analysis, are as follows:
(In millions of Korean won)
Classication
Favorable Changes Unfavorable Changes
Prot or Loss Equity Prot or Loss Equity
Available-for-sale nancial assets (*1) - 35,324 - (27,586)
Embedded derivatives (convertible bonds, etc.)(*2) 1,457 1,457 (1,499) (1,499)
Total 1,457 36,781 (1,499) (29,085)
(*1) For equity securities, changes in their fair value are calculated by increasing or decreasing the correlation between growth ratio (-1%~1%) and discount rate,
which are signicant unobservable inputs.
(*2) For equity derivatives, changes in their fair value are calculated by increasing or decreasing the correlation between stock prices and volatility by 10%.
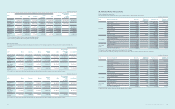
33. Segment Information
(A) Operating segment information
The chief operating decision maker has been identied as the Management Committee. The Management Committee is responsible for making strategic decisions
based on review of the group’s internal reporting. The Management Committee has determined the operating segments based on these reports.
The Management Committee reviews operating prots of each operating segment in order to assess performance and to make decisions about allocating
resources to the segment.
The operating segments are product based and include CE, IM, Semiconductor, DP and others. Operating segment information for the year ended December 31,
2012 has been restated in accordance with the organizational changes.
Depreciation, amortization of intangible assets, and operating prot were prepared after the allocation of internal transaction adjustments. Total assets and
liabilities of each operating segment are excluded from the disclosure as it has not been provided regularly to the Management Committee.
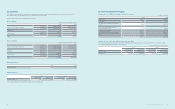
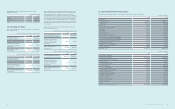
The segment information provided to the Management committee for the reportable segments for the years ended December 31 2013 and 2012, is as follows:
(In millions of Korean won)
2013
DS
Total (*1)
Intercompany
elimination
within
the group
Consolidated
CE IM Total (*1) Semi
conductor DP
Total segment
revenue 125,088,762 299,161,654 134,394,781 70,908,145 61,294,886 558,196,178 (329,503,511) 228,692,667
Intercompany
revenue (74,757,247) (160,344,435) (66,633,875) (33,471,566) (31,457,770) (329,503,511) 329,503,511 -
Net revenue
(*2) 50,331,515 138,817,219 67,760,906 37,436,579 29,837,116 228,692,667 - 228,692,667
Depreciation 653,354 632,498 13,689,148 9,295,951 4,203,457 15,470,012 - 15,470,012
Amortization 93,699 188,353 416,916 294,605 106,249 975,401 - 975,401
Operating
prot 1,673,343 24,957,741 10,000,665 6,887,978 2,980,563 36,785,013 - 36,785,013