Samsung 2013 Annual Report Download - page 35
Download and view the complete annual report
Please find page 35 of the 2013 Samsung annual report below. You can navigate through the pages in the report by either clicking on the pages listed below, or by using the keyword search tool below to find specific information within the annual report.-
 1
1 -
2
-
3
-
4
-
5
-
6
-
7
-
8
-
9
-
10
-
11
-
12
-
13
-
14
-
15
-
16
-
17
-
18
-
19
-
20
-
21
-
22
-
23
-
24
-
 25
25 -
 26
26 -
 27
27 -
 28
28 -
 29
29 -
 30
30 -
 31
31 -
 32
32 -
 33
33 -
 34
34 -
 35
35 -
 36
36 -
 37
37 -
 38
38 -
 39
39 -
 40
40 -
 41
41 -
 42
42 -
 43
43 -
 44
44 -
 45
45 -
46
-
47
-
48
-
49
-
50
-
51
-
52
-
53
-
54
-
55
-
56
-
57
-
58
 |
 |
66 67
2013 SAMSUNG ELECTRONICS ANNUAL REPORT
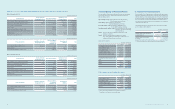
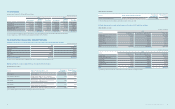
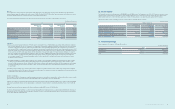
Changes in valuation gains (losses) recognized in equity (other
comprehensive income) on short-term available-for-sale nancial assets for
the years ended December 31, 2013 and 2012, are as follows:
(In millions of Korean won)
2013 2012
Balance as of January 1 ₩8,873 ₩5,969
Fair value gains 7,492 8,873
Net gains transferred from equity (8,873) (5,969)
Balance as of December 31 7,492 8,873
Deferred income tax (1,813) (2,147)
₩5,679 ₩6,726
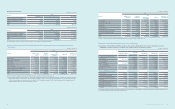
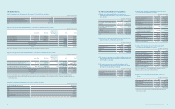
(B) Long-term available-for-sale nancial assets
Details of long-term available-for-sale nancial assets as of December 31,
2013 and 2012, are as follows:
(In millions of Korean won)
Detail 2013 2012
Equity securities - Listed (1) ₩4,399,314 ₩4,435,856
Equity securities - Non-listed (2) 782,297 667,325
Debt securities (*) (3) 1,056,769 125,994
₩6,238,380 ₩5,229,175
(*) The maximum exposure to credit risk of available-for-sale debt securities
is the carrying value at the reporting date.
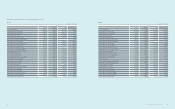
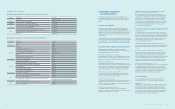
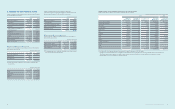
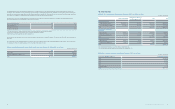
9. Available-for-Sale Financial Assets
Changes in available-for-sale nancial assets for the years ended December
31, 2013 and 2012, are as follows:
(In millions of Korean won)
2013 2012
Balance as of January 1 ₩6,488,049 ₩3,879,567
Acquisitions 4,031,357 2,613,703
Increase from business combinations - 16,544
Disposals (4,120,906) (1,171,666)
Gain on valuation of available-for-
sale nancial assets 1,271,817 1,185,256
Impairment (5,177) (28,009)
Foreign exchange differences 939 (19,302)
Others 60,828 11,956
Balance as of December 31 ₩7,726,907 ₩6,488,049
(A) Current portion 1,488,527 1,258,874
(B) Non-current portion 6,238,380 5,229,175
(A) Short-term available-for-sale nancial assets
Details of short-term available-for-sale nancial assets as of December 31,
2013 and 2012, are as follows:
(In millions of Korean won)
2013 2012
Beneciary certicates (*) ₩1,257,492 ₩1,258,873
National bonds 180,959 1
Bank debentures 50,076 -
₩1,488,527 ₩1,258,874
(*) Details of beneciary certicates as of December 31, 2013 and 2012,
are as follows:
(In millions of Korean won)
2013 2012
Bonds ₩1,232,523 ₩1,159,290
Time deposits 364 238
Call loans 15,449 85,200
Others 9,156 14,145
₩1,257,492 ₩1,258,873
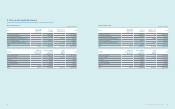
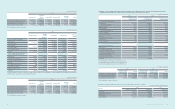
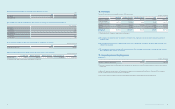
(1) Equity securities - Listed (excluding investments in associates and joint ventures)
Details of listed equity securities as of December 31, 2013 and 2012, are as follows:
(In millions of Korean won, number of shares and percentage)
2013 2012
Number of
Shares Owned
Percentage of
Ownership (%) Acquisition Cost Book Value
(Market Value)
Book Value
(Market Value)
Samsung Heavy Industries 40,675,641 17.6 ₩258,299 ₩1,547,708 ₩1,568,046
Samsung Fine Chemicals 2,164,970 8.4 45,678 96,449 132,063
Hotel Shilla 2,004,717 5.1 13,957 133,314 88,107
Cheil Worldwide 2,998,725 2.6 2,920 82,465 64,623
iMarket Korea 647,320 1.8 324 16,668 18,416
SFA 1,822,000 10.2 38,262 74,884 85,998
Wonik IPS 7,220,216 9.0 63,249 61,949 -
ASML 12,595,575 2.9 726,024 1,248,019 856,253
CSR 9,925,000 6.0 59,612 110,135 58,765
Rambus 4,788,125 4.2 92,682 47,851 24,976
Seagate Technology (*) 12,539,490 3.8 218,544 743,161 1,474,032
Wacom 8,398,400 5.0 62,013 62,268 -
Sharp 35,804,000 2.1 122,535 120,143 -
Others - - 59,328 54,300 64,577
₩1,763,427 ₩4,399,314 ₩4,435,856
(*) In October 2013, the Company sold part of its investment in Seagate Technology for USD 1,505 million.
Acquisition cost includes impairment loss on available-for-sale nancial assets recognized due to the decline in realizable value below acquisition cost.
The difference between the acquisition cost and the current fair value, after income tax effects, is recorded within other components of equity
(unrealized gains or losses on available-for-sale nancial assets).