Samsung 2013 Annual Report Download - page 36
Download and view the complete annual report
Please find page 36 of the 2013 Samsung annual report below. You can navigate through the pages in the report by either clicking on the pages listed below, or by using the keyword search tool below to find specific information within the annual report.-
 1
1 -
2
-
3
-
4
-
5
-
6
-
7
-
8
-
9
-
10
-
11
-
12
-
13
-
14
-
15
-
16
-
17
-
18
-
19
-
20
-
21
-
22
-
23
-
24
-
25
-
 26
26 -
 27
27 -
 28
28 -
 29
29 -
 30
30 -
 31
31 -
 32
32 -
 33
33 -
 34
34 -
 35
35 -
 36
36 -
 37
37 -
 38
38 -
 39
39 -
 40
40 -
 41
41 -
 42
42 -
 43
43 -
 44
44 -
 45
45 -
 46
46 -
47
-
48
-
49
-
50
-
51
-
52
-
53
-
54
-
55
-
56
-
57
-
58
 |
 |
68 69
2013 SAMSUNG ELECTRONICS ANNUAL REPORT
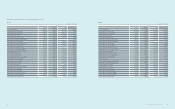
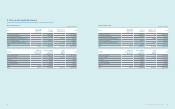
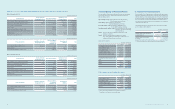
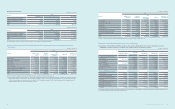
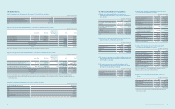
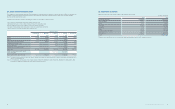
(2) Equity securities - Non-listed (excluding investments in associates and joint ventures)
Details of non-listed equity securities as of December 31, 2013 and 2012, are as follows:
(In millions of Korean won, number of shares and percentage)
2013 2012
Number of
Shares Owned
Percentage of
Ownership (%) Acquisition Cost Book Value Book Value
Kihyup Technology 1,000,000 17.2 ₩5,000 ₩5,000 ₩5,000
Pusan Newport (*1) 1,135,307 1.0 5,677 5,677 5,677
Samsung Venture Investment 980,000 16.3 4,900 7,021 6,053
Samsung Petrochemical 514,172 13.0 8,040 80,347 84,427
Samsung General Chemicals 1,914,251 3.9 19,143 80,653 74,487
Taewon Electric 9,000 15.0 16,544 17,072 16,225
CSOT (*2) - 14.5 278,130 278,130 278,130
Pantech 53,000,000 10.0 53,000 53,053 -
Nanosys (*2) 13,100,436 13.0 17,861 17,861 17,861
OpenX (*2) 8,899,172 3.5 10,738 10,738 10,738
Others (*3) - - 242,069 226,745 168,727
₩661,102 ₩782,297 ₩667,325
(*1) As of December 31, 2013, the Company’s investments in Pusan Newport are pledged as collateral against the investee’s debt (Note 19).
(*2) Nonmarketable shares including CSOT are measured at cost as the range of reasonable fair value estimates is signicant and the probabilities of the various
estimates and applicable discount rate cannot be reasonably assessed.
(*3) Impairment losses on unlisted equity securities resulting from the decline in realizable value below the acquisition cost amounted to ₩5,177 million and
₩2,235 million for the years ended December 31, 2013 and 2012, respectively.
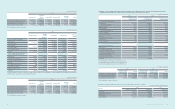
(3) Debt securities
Details of debt securities as of December 31, 2013 and 2012, are as follows:
(In millions of Korean won)
2013 2012
Corporate bonds ₩106,944 ₩125,894
Government and public bonds 50,356 100
Bank debentures 899,469 -
₩1,056,769 ₩125,994
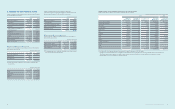
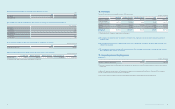
Changes in valuation gain (loss) on long-term available-for-sale nancial assets for the years ended December 31, 2013 and 2012, are as follows:
(In millions of Korean won)
2013 2012
Balance as of January 1 ₩2,572,755 ₩1,367,331
Fair value gain 1,264,325 1,176,383
Net gains or losses transferred from equity (991,387) 29,041
Balance as of December 31 2,845,693 2,572,755
Deferred income tax and non-controlling interests (662,359) (577,945)
₩2,183,334 ₩1,994,810
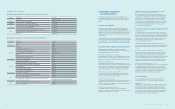
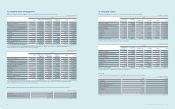
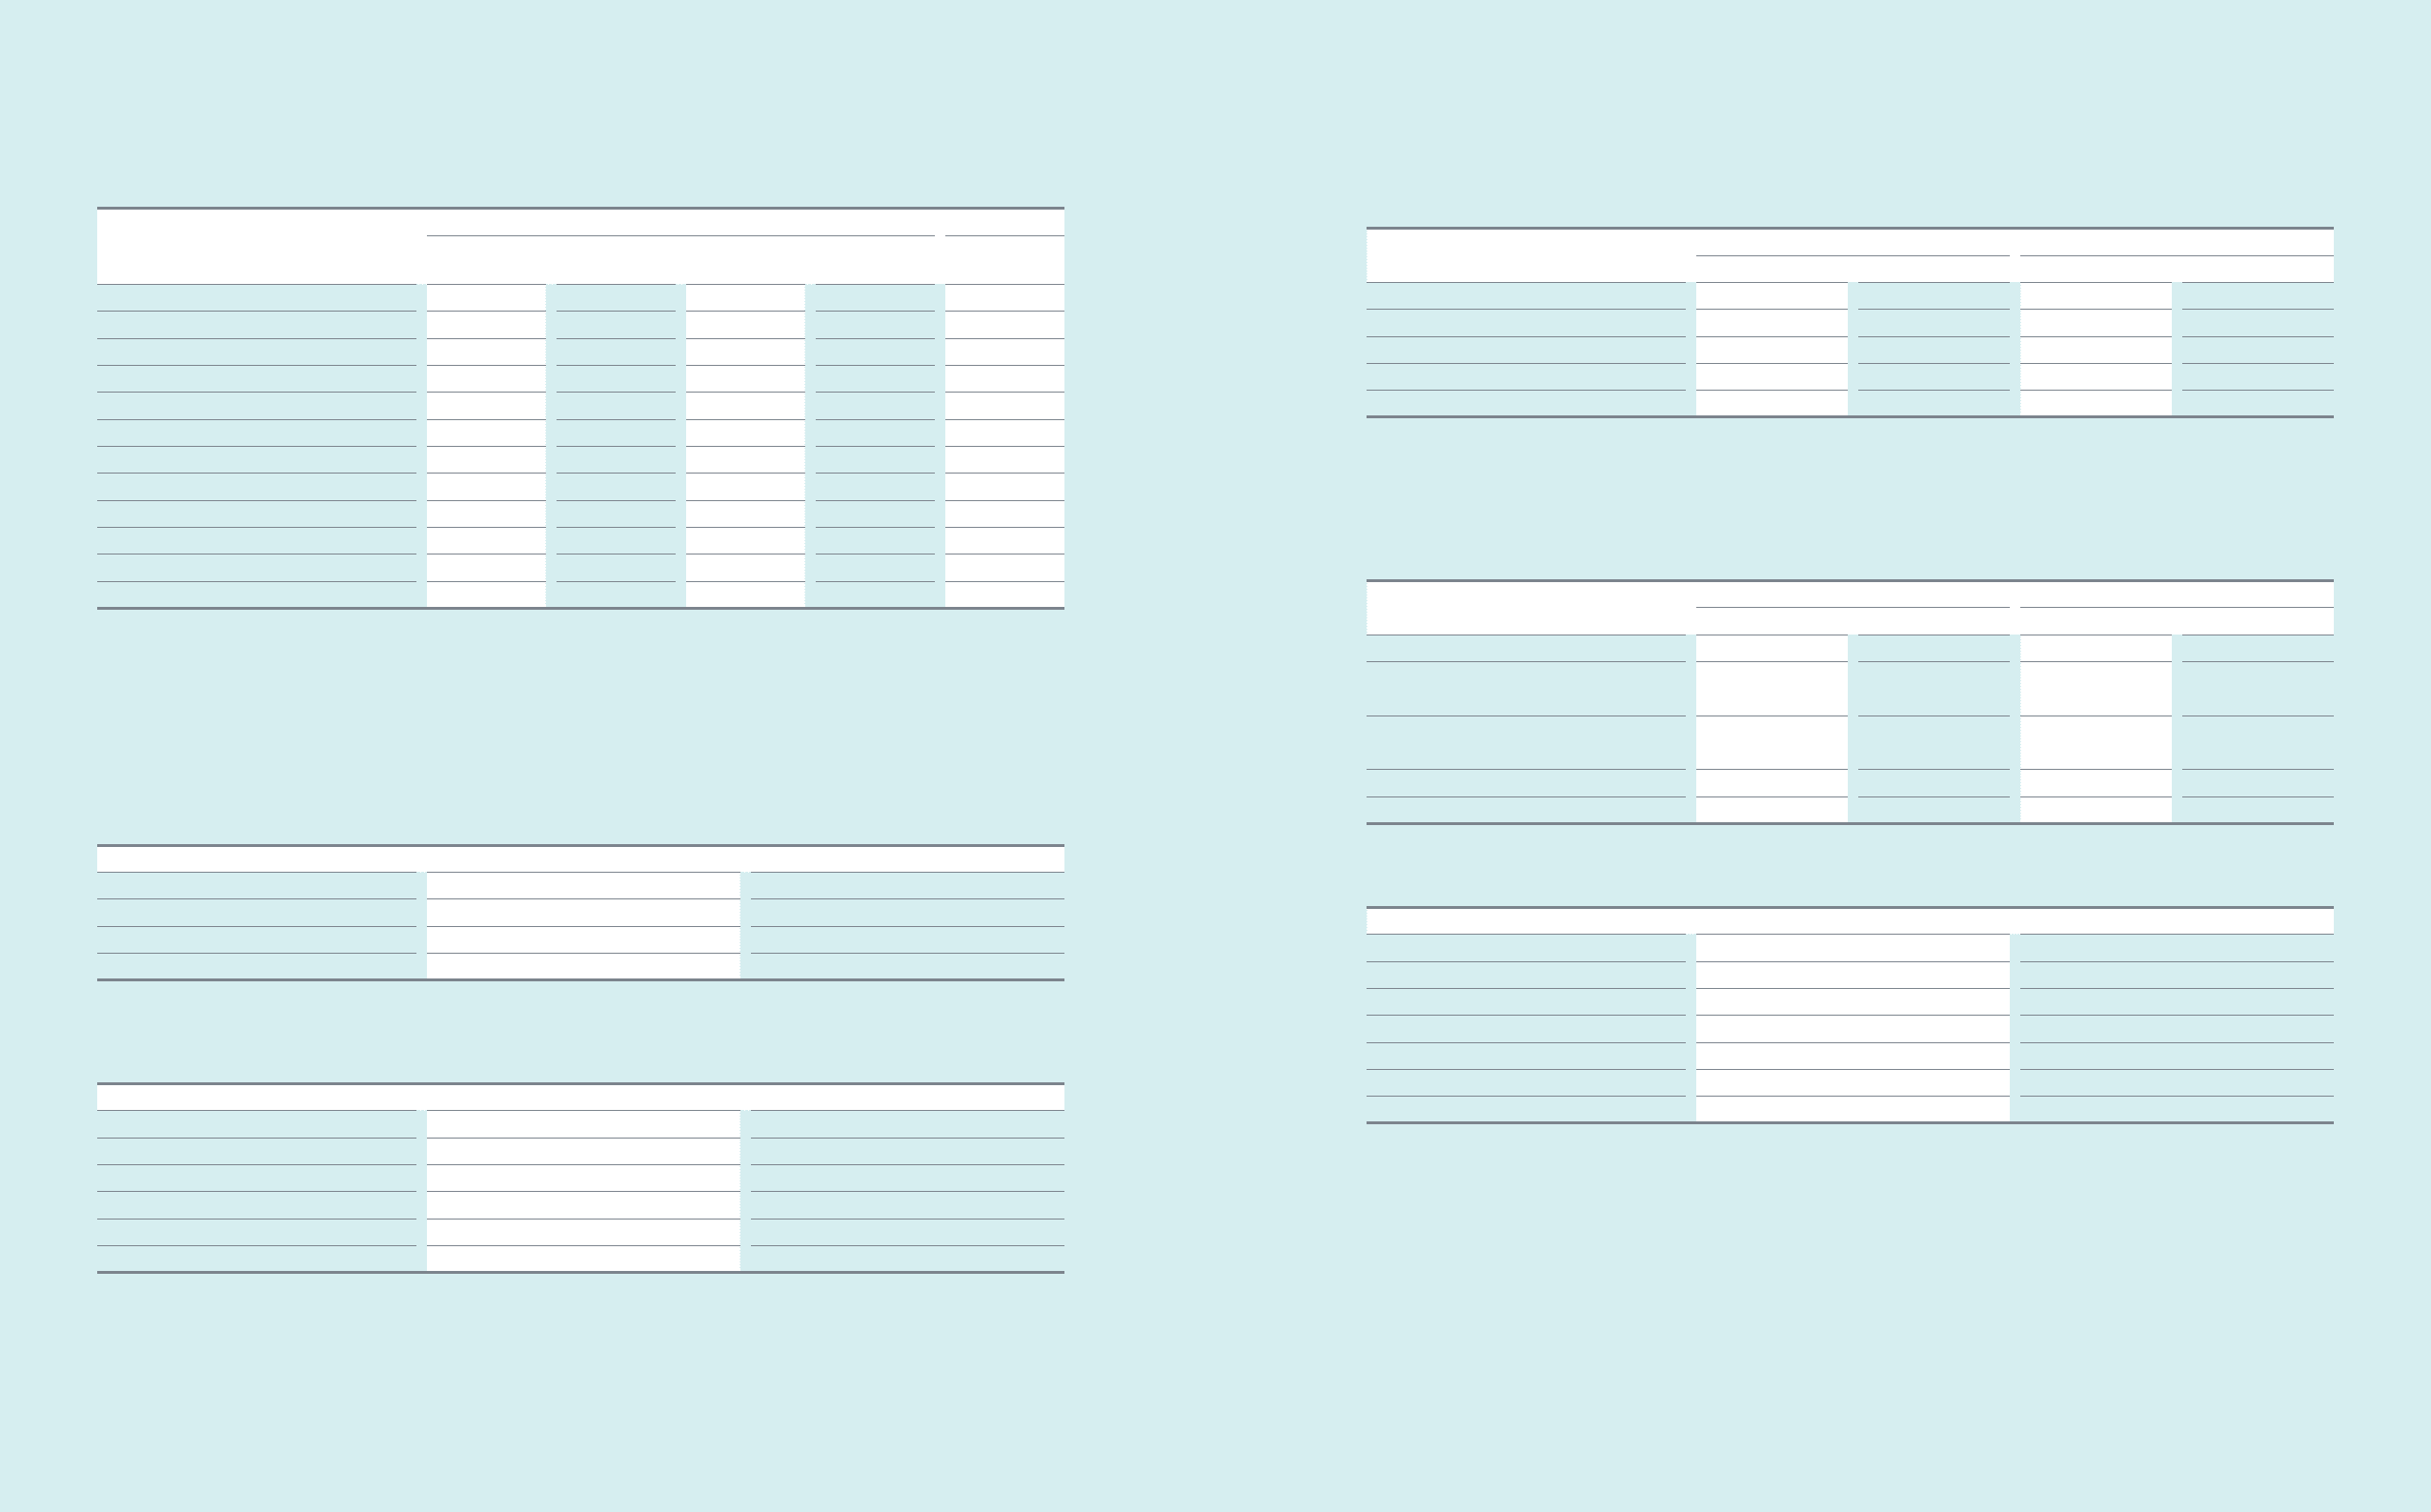
10. Trade and Other Receivables
(A) Trade and other receivables, and provisions for impairment as of December 31, 2013 and 2012, are as follows:
(In millions of Korean won)
2013 2012
Trade Non-Trade Trade Non-Trade
Receivables ₩25,292,231 ₩2,931,605 ₩24,168,427 ₩2,834,187
Less: Provisions for impairment (267,675) (20,046) (276,787) (2,595)
Receivables, net 25,024,556 2,911,559 23,891,640 2,831,592
Less: Non-current portion (36,024) (24,157) (30,405) (18,231)
Current portion ₩24,988,532 ₩2,887,402 ₩23,861,235 ₩2,813,361
The Company transferred receivable balances to a bank in exchange for cash during the years ended December 31, 2013 and 2012. The outstanding balances
of transferred receivables amounting to ₩3,256,935 million and ₩4,328,503 million have been accounted for as borrowings as of December 31, 2013 and 2012,
respectively (Note 15).
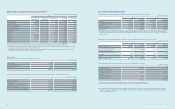
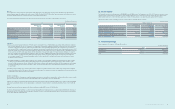
(B) Movements in the provisions for impairment of receivables for the years ended December 31, 2013 and 2012, are as follows:
(In millions of Korean won)
2013 2012
Trade Non-Trade Trade Non-Trade
Balance as of January 1 ₩(276,787) ₩(2,595) ₩(214,597) ₩(37,833)
Provisions for impaired receivables
(reversals of unused amounts) (2,785) (18,794) (83,588) 6,370
Receivables written off during the year as
uncollectible 13,787 511 18,752 28,203
Others (1,890) 832 2,646 665
Balance as of December 31 ₩(267,675) ₩(20,046) ₩(276,787) ₩(2,595)
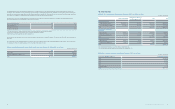
(C) The aging analysis of trade and other receivables as of December 31, 2013 and 2012, is as follows:
(In millions of Korean won)
2013 2012
Receivables not past due ₩25,420,912 ₩24,151,060
Past due but not impaired (*1):
Less than 31 days overdue 2,058,708 2,226,759
Impaired (*2):
31 days to 90 days overdue 184,405 231,343
90 days overdue or more 559,811 393,452
₩28,223,836 ₩27,002,614
(*1) The Company does not consider receivables that are overdue for less than or equal to 31 days as impaired.
(*2) Provisions for impaired receivable amount to ₩287,721 million as of December 31, 2013 (2012: ₩279,382 million).
(D) The maximum exposure to credit risk at the reporting date is the carrying value of each class of receivable mentioned above. As of December 31,
2013, the Company has credit insurance with Korea Trade Insurance and overseas insurance companies against its export accounts receivables
from approved foreign customers.