Samsung 2013 Annual Report Download - page 48
Download and view the complete annual report
Please find page 48 of the 2013 Samsung annual report below. You can navigate through the pages in the report by either clicking on the pages listed below, or by using the keyword search tool below to find specific information within the annual report.-
 1
1 -
2
-
3
-
4
-
5
-
6
-
7
-
8
-
9
-
10
-
11
-
12
-
13
-
14
-
15
-
16
-
17
-
18
-
19
-
20
-
21
-
22
-
23
-
24
-
25
-
26
-
27
-
28
-
29
-
30
-
31
-
32
-
33
-
34
-
35
-
36
-
37
-
 38
38 -
 39
39 -
 40
40 -
 41
41 -
 42
42 -
 43
43 -
 44
44 -
 45
45 -
 46
46 -
 47
47 -
 48
48 -
 49
49 -
 50
50 -
 51
51 -
 52
52 -
 53
53 -
 54
54 -
 55
55 -
 56
56 -
 57
57 -
 58
58
 |
 |

92 93
2013 SAMSUNG ELECTRONICS ANNUAL REPORT
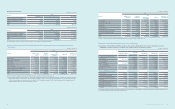
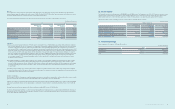
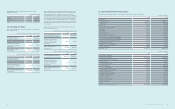
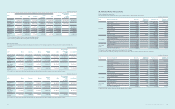
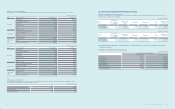
(2) As of December 31, 2012
(In millions of Korean won)
Temporary Differences Deferred Income Tax Assets (Liabilities)
Balance as of
January 1
Increase
(Decrease)
Balance as of
December 31
Balance as of
January 1
Increase
(Decrease)
Balance as of
December 31
Deferred tax arising from temporary
differences
Special reserves appropriated for tax purposes ₩(18,146) ₩(14,951) ₩(33,097) ₩(4,391) ₩(3,619) ₩(8,010)
Revaluation of land (4,017,316) 539,625 (3,477,691) (972,191) 130,590 (841,601)
Investments in subsidiaries, associates and
joint ventures (*) (13,450,537) (11,813,329) (25,263,866) (3,032,268) (650,000) (3,682,268)
Depreciation (13,547) 1,250,940 1,237,393 (62,124) 255,468 193,344
Accrued income (92,953) (31,224) (124,177) (21,337) (6,826) (28,163)
Provisions, accrued expenses and others 7,144,431 3,217,777 10,362,208 1,806,514 750,331 2,556,845
Foreign currency translation 150,908 (164,168) (13,260) 35,482 (41,449) (5,967)
Asset impairment losses 52,901 37,755 90,656 10,937 5,587 16,524
Others 779,626 (1,673,860) (894,234) 288,217 (459,967) (171,750)
Subtotal ₩(9,464,633) ₩(8,651,435) ₩(18,116,068) ₩(1,951,161) ₩(19,885) ₩(1,971,046)
Deferred tax arising from carryforwards
Undisposed accumulated decit ₩100,401 ₩30,591 ₩130,992 ₩26,961 ₩850 ₩27,811
Tax credit carryforwards 1,512,052 (195,543) 1,316,509 1,495,747 (235,640) 1,260,107
Deferred tax recognized in other
comprehensive income
Valuation of available-for-sale nancial
instruments ₩(1,316,863) ₩(1,264,765) ₩(2,581,628) ₩(318,052) ₩(262,040) ₩(580,092)
Actuarial valuation 813,514 657,804 1,471,318 196,149 153,684 349,833
Subtotal ₩(503,349) ₩(606,961) ₩(1,110,310) ₩(121,903) ₩(108,356) ₩(230,259)
Deferred tax assets ₩2,516,080
Deferred tax liabilities (3,429,467)
Total ₩(913,387)
(*) Deferred tax assets were not recognized if it is probable that the temporary differences will not reverse in the foreseeable future for investments in subsidiaries,
associates and joint ventures.
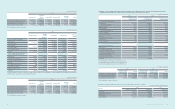
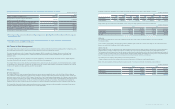
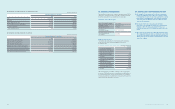
The Company periodically assesses its ability to recover deferred income tax assets. In the event of a signicant uncertainty regarding the Company’s ultimate
ability to recover such assets, deferred income tax assets are recognized only to the extent that it is probable that future taxable prot will be available against
which the temporary differences can be utilized.
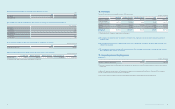
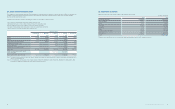
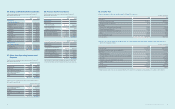
Temporary differences whose deferred tax effects were not recognized due to the uncertainty regarding ultimate realizability of such assets as of December 31,
2013 and 2012 are as follows:
(In millions of Korean won)
2013 2012
Unused tax losses ₩12,196 ₩ -
Unused tax credits 30,098 48,262
Expiry dates of unused tax losses and unused tax credits for which no deferred tax asset is recognized in the balance sheet are as follows:
(In millions of Korean won)
2014 2015 2016 2017 and after
Undisposed accumulated decit ₩ -₩ -₩ -₩12,196
Tax credit carryforwards 4,170 3,437 18,525 3,966
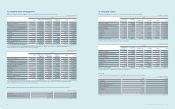
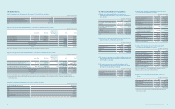
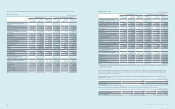
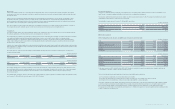
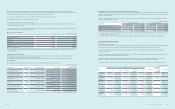
(C) Deferred income tax assets and liabilities resulting from the tax effect of temporary differences as of December 31, 2013 and 2012, are as follows:
(1) As of December 31, 2013
(In millions of Korean won)
Temporary Differences Deferred Income Tax Assets (Liabilities)
Balance as of
January 1
Increase
(Decrease)
Balance as of
December 31
Balance as of
January 1
Increase
(Decrease)
Balance as of
December 31
Deferred tax arising from temporary
differences
Special reserves appropriated for tax purposes ₩(33,097) ₩5,312 ₩(27,785) ₩(8,010) ₩1,286 ₩(6,724)
Revaluation of land (3,477,691) 1,587 (3,476,104) (841,601) 384 (841,217)
Investments in subsidiaries, associates and
joint ventures (*) (25,263,866) (2,555,796) (27,819,662) (3,682,268) (318,359) (4,000,627)
Depreciation 1,237,393 (402,647) 834,746 193,344 (57,968) 135,376
Accrued income (124,177) (179,613) (303,790) (28,163) (44,682) (72,845)
Provisions, accrued expenses and others 10,362,208 1,983,485 12,345,693 2,556,845 596,301 3,153,146
Foreign currency translation (13,260) (168,042) (181,302) (5,967) (38,058) (44,025)
Asset impairment losses 90,656 251,433 342,089 16,524 65,375 81,899
Assets held for sale - 7,527,869 7,527,869 - 1,821,744 1,821,744
Others (894,234) (10,818,680) (11,712,914) (171,750) (2,527,473) (2,699,223)
Subtotal ₩(18,116,068) ₩(4,355,092) ₩(22,471,160) ₩(1,971,046) ₩(501,450) ₩(2,472,496)
Deferred tax arising from carryforwards
Unused tax losses ₩130,992 ₩(23,764) ₩107,228 ₩27,811 ₩(2,805) ₩25,006
Unused tax credits 1,316,509 25,141 1,341,650 1,260,107 52,085 1,312,192
Deferred tax recognized in other
comprehensive income
Valuation of available-for-sale nancial
instruments ₩(2,581,628) ₩(306,252) ₩(2,887,880) ₩(580,092) ₩(84,080) ₩(664,172)
Actuarial valuation 1,471,318 247,136 1,718,454 349,833 59,046 408,879
Subtotal ₩(1,110,310) ₩(59,116) ₩(1,169,426) ₩(230,259) ₩(25,034) ₩(255,293)
Deferred tax assets ₩4,621,780
Deferred tax liabilities (6,012,371)
Total ₩(1,390,591)