Samsung 2013 Annual Report Download - page 47
Download and view the complete annual report
Please find page 47 of the 2013 Samsung annual report below. You can navigate through the pages in the report by either clicking on the pages listed below, or by using the keyword search tool below to find specific information within the annual report.-
 1
1 -
2
-
3
-
4
-
5
-
6
-
7
-
8
-
9
-
10
-
11
-
12
-
13
-
14
-
15
-
16
-
17
-
18
-
19
-
20
-
21
-
22
-
23
-
24
-
25
-
26
-
27
-
28
-
29
-
30
-
31
-
32
-
33
-
34
-
35
-
36
-
 37
37 -
 38
38 -
 39
39 -
 40
40 -
 41
41 -
 42
42 -
 43
43 -
 44
44 -
 45
45 -
 46
46 -
 47
47 -
 48
48 -
 49
49 -
 50
50 -
 51
51 -
 52
52 -
 53
53 -
 54
54 -
 55
55 -
 56
56 -
 57
57 -
58
 |
 |

90 91
2013 SAMSUNG ELECTRONICS ANNUAL REPORT
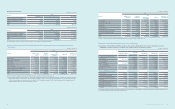
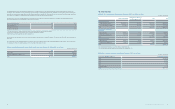
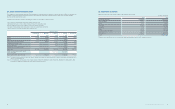
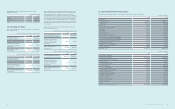
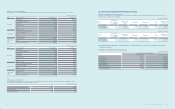
29. Income Tax
(A) Income tax expense for the years ended December 31, 2013 and 2012, consists of:
(In millions of Korean won)
2013 2012
Current taxes:
Current tax on prots for the year ₩7,406,736 ₩5,656,298
Adjustments in respect of prior years 52,318 95,296
Deferred taxes:
Changes in the carryforward of unused tax credits (52,085) 235,640
Changes in temporary differences 501,450 19,885
Changes in the carryforward of unused tax losses 2,805 (850)
Others (10,490) 60,654
Items charged directly to equity (11,219) 2,809
Income tax expense ₩7,889,515 ₩6,069,732
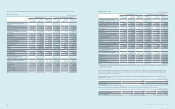
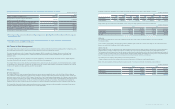
(B) The tax on the Company’s prot before tax differs from the theoretical amount that would arise using the weighted average tax rate applicable to
prots of the Company as follows:
(In millions of Korean won)
2013 2012
Income before tax ₩38,364,279 ₩29,915,017
Tax calculated at weighted average tax rates applicable (*) 9,576,241 7,664,722
Tax effects of:
Permanent differences (335,146) (161,762)
Temporary differences for which no deferred income tax was recognized 1,307 (7,930)
Tax credit (2,156,519) (1,980,710)
Subsidiaries, associates and interests in joint ventures 318,359 650,000
Impact of changes in tax rates 5,526 (3,602)
Others 479,747 (90,986)
Income tax expense ₩7,889,515 ₩6,069,732
Effective tax rate 20.56% 20.29%
(*) Weighted average statutory tax rates that are applied differently for the prots of the Company at each tax authority as of December 31, 2013 and 2012.
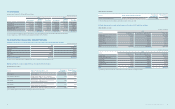
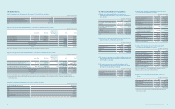
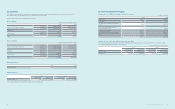
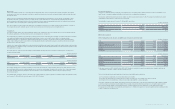
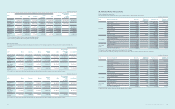
26. Selling and Administrative Expenses
Selling and administrative expenses for the years ended December 31,
2013 and 2012, are as follows:
(In millions of Korean won)
2013 2012
1) Selling and
Administrative Expenses
Wages and salaries ₩5,559,339 ₩4,032,848
Pension 232,676 204,929
Commission and service charges 9,124,803 6,961,701
Depreciation 555,944 442,080
Amortization 401,987 353,909
Advertising 4,165,290 4,887,089
Sales promotion 8,019,462 6,055,105
Transportation 3,929,114 3,794,950
Warranty 2,967,724 3,247,757
Others 4,935,604 3,889,181
2) Research and
development expenses
Total expenses 14,780,432 11,892,434
Capitalized expenses (461,030) (359,639)
Total ₩54,211,345 ₩45,402,344
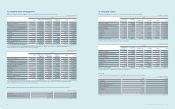
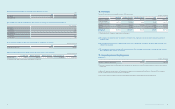
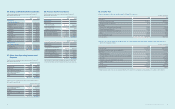
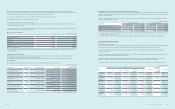
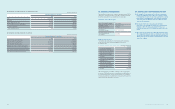
Details of other non-operating income for the years ended December 31,
2013 and 2012, are as follows:
(In millions of Korean won)
2013 2012
Dividend income ₩112,159 ₩106,181
Rental income 104,608 98,462
Gain on disposal of investments 1,117,029 112,505
Gain on disposal of property,
plant and equipment 110,638 147,645
Others 985,117 1,088,196
₩2,429,551 ₩1,552,989
Details of other non-operating expense for the years ended December 31,
2013 and 2012, are as follows:
(In millions of Korean won)
2013 2012
Loss on disposal of property,
plant and equipment ₩187,863 ₩324,993
Donations 495,301 235,349
Impairment losses on intangible assets 108,420 216,790
Others 822,464 798,893
₩1,614,048 ₩1,576,025
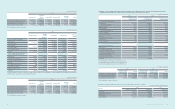
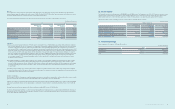
28. Finance Income and Costs
Details of nance income and costs for the years ended December 31,
2013 and 2012, are as follows:
(In millions of Korean won)
2013 2012
Finance income
Interest income
Interest income from
loans and receivables ₩1,342,394 ₩840,150
Interest income from
available-for-sale nancial assets 9,215 5,281
Foreign exchange differences 6,199,517 6,452,612
Gains on valuation of derivatives 65,787 27,719
Gains on derivatives transaction 397,759 510,792
₩8,014,672 ₩7,836,554
(In millions of Korean won)
2013 2012
Finance costs
Interest expense:
Interest expense from nancial
liabilities measured at amortized cost ₩319,342 ₩277,512
Other nancial liabilities 190,316 321,494
Foreign exchange differences 6,529,622 6,596,524
Losses on valuation of derivatives 209,311 124,344
Losses on derivatives transaction 506,381 614,576
₩7,754,972 ₩7,934,450
The Company recognizes foreign exchange gains and losses arising from
foreign currency transactions and translation as nance income and costs.
27. Other Non-Operating Income and
Expense