Samsung 2013 Annual Report Download - page 42
Download and view the complete annual report
Please find page 42 of the 2013 Samsung annual report below. You can navigate through the pages in the report by either clicking on the pages listed below, or by using the keyword search tool below to find specific information within the annual report.-
 1
1 -
2
-
3
-
4
-
5
-
6
-
7
-
8
-
9
-
10
-
11
-
12
-
13
-
14
-
15
-
16
-
17
-
18
-
19
-
20
-
21
-
22
-
23
-
24
-
25
-
26
-
27
-
28
-
29
-
30
-
31
-
 32
32 -
 33
33 -
 34
34 -
 35
35 -
 36
36 -
 37
37 -
 38
38 -
 39
39 -
 40
40 -
 41
41 -
 42
42 -
 43
43 -
 44
44 -
 45
45 -
 46
46 -
 47
47 -
 48
48 -
 49
49 -
 50
50 -
 51
51 -
 52
52 -
53
-
54
-
55
-
56
-
57
-
58
 |
 |
80 81
2013 SAMSUNG ELECTRONICS ANNUAL REPORT
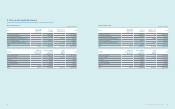
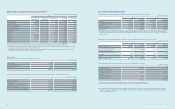
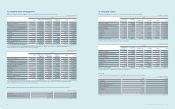
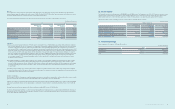
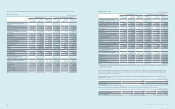
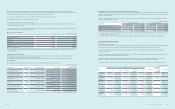
16. Debentures
Details of carrying amount of debentures as of December 31, 2013 and 2012, are as follows:
(In millions of Korean won)
2013 2012
Korean won denominated debentures (A) ₩198,566 ₩697,822
Foreign currency denominated debentures (B) 1,112,502 1,131,552
Total ₩1,311,068 ₩1,829,374
(A) Details of Korean won denominated debentures as of December 31, 2013 and 2012, are as follows:
(In millions of Korean won)
Issue Date Due Date
Annual Interest
Rates (%) as of
December 31,
2013
2013 2012
Unsecured debentures 2010.6.17 2013.6.17 - - 500,000
Unsecured debentures 2011.11.17 2014.11.17 4.1 500,000 500,000
Unsecured debentures 2011.11.17 2016.11.17 4.2 200,000 200,000
Less: Current portion (500,000) (500,000)
Less: Discounts (1,434) (2,178)
Total 198,566 697,822
All the above debentures have been issued by Samsung Display and will be repaid upon maturity.
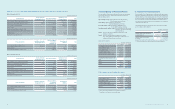
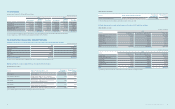
(B) Details of foreign currency denominated debentures as of December 31, 2013 and 2012, are as follows:
(In millions of Korean won)
Issue Date Due Date
Annual Interest
Rates (%) as of
December 31,
2013
2013 2012
US dollar denominated straight bonds (*1) 1997.10.2 2027.10.1 7.7 ₩73,871
(US$70 million)
₩80,333
(US$75 million)
US dollar denominated unsecured bonds (*2) 2012.4.10 2017.4.10 1.8 1,055,300
(US$1,000 million)
1,071,100
(US$1,000 million)
Less: Current portion (5,277) (5,356)
Less: Discounts (11,392) (14,525)
Total ₩1,112,502 ₩1,131,552
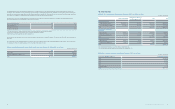
(*1) US dollar straight bonds are repaid annually for twenty years after a ten-year grace period from the date of issuance. Interest is paid semi-annually.
(*2) Samsung Electronics America issued dollar denominated unsecured bonds. Repayment of these debentures is due on the date of maturity and interest is
paid semi-annually.
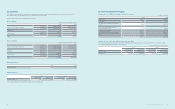
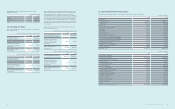
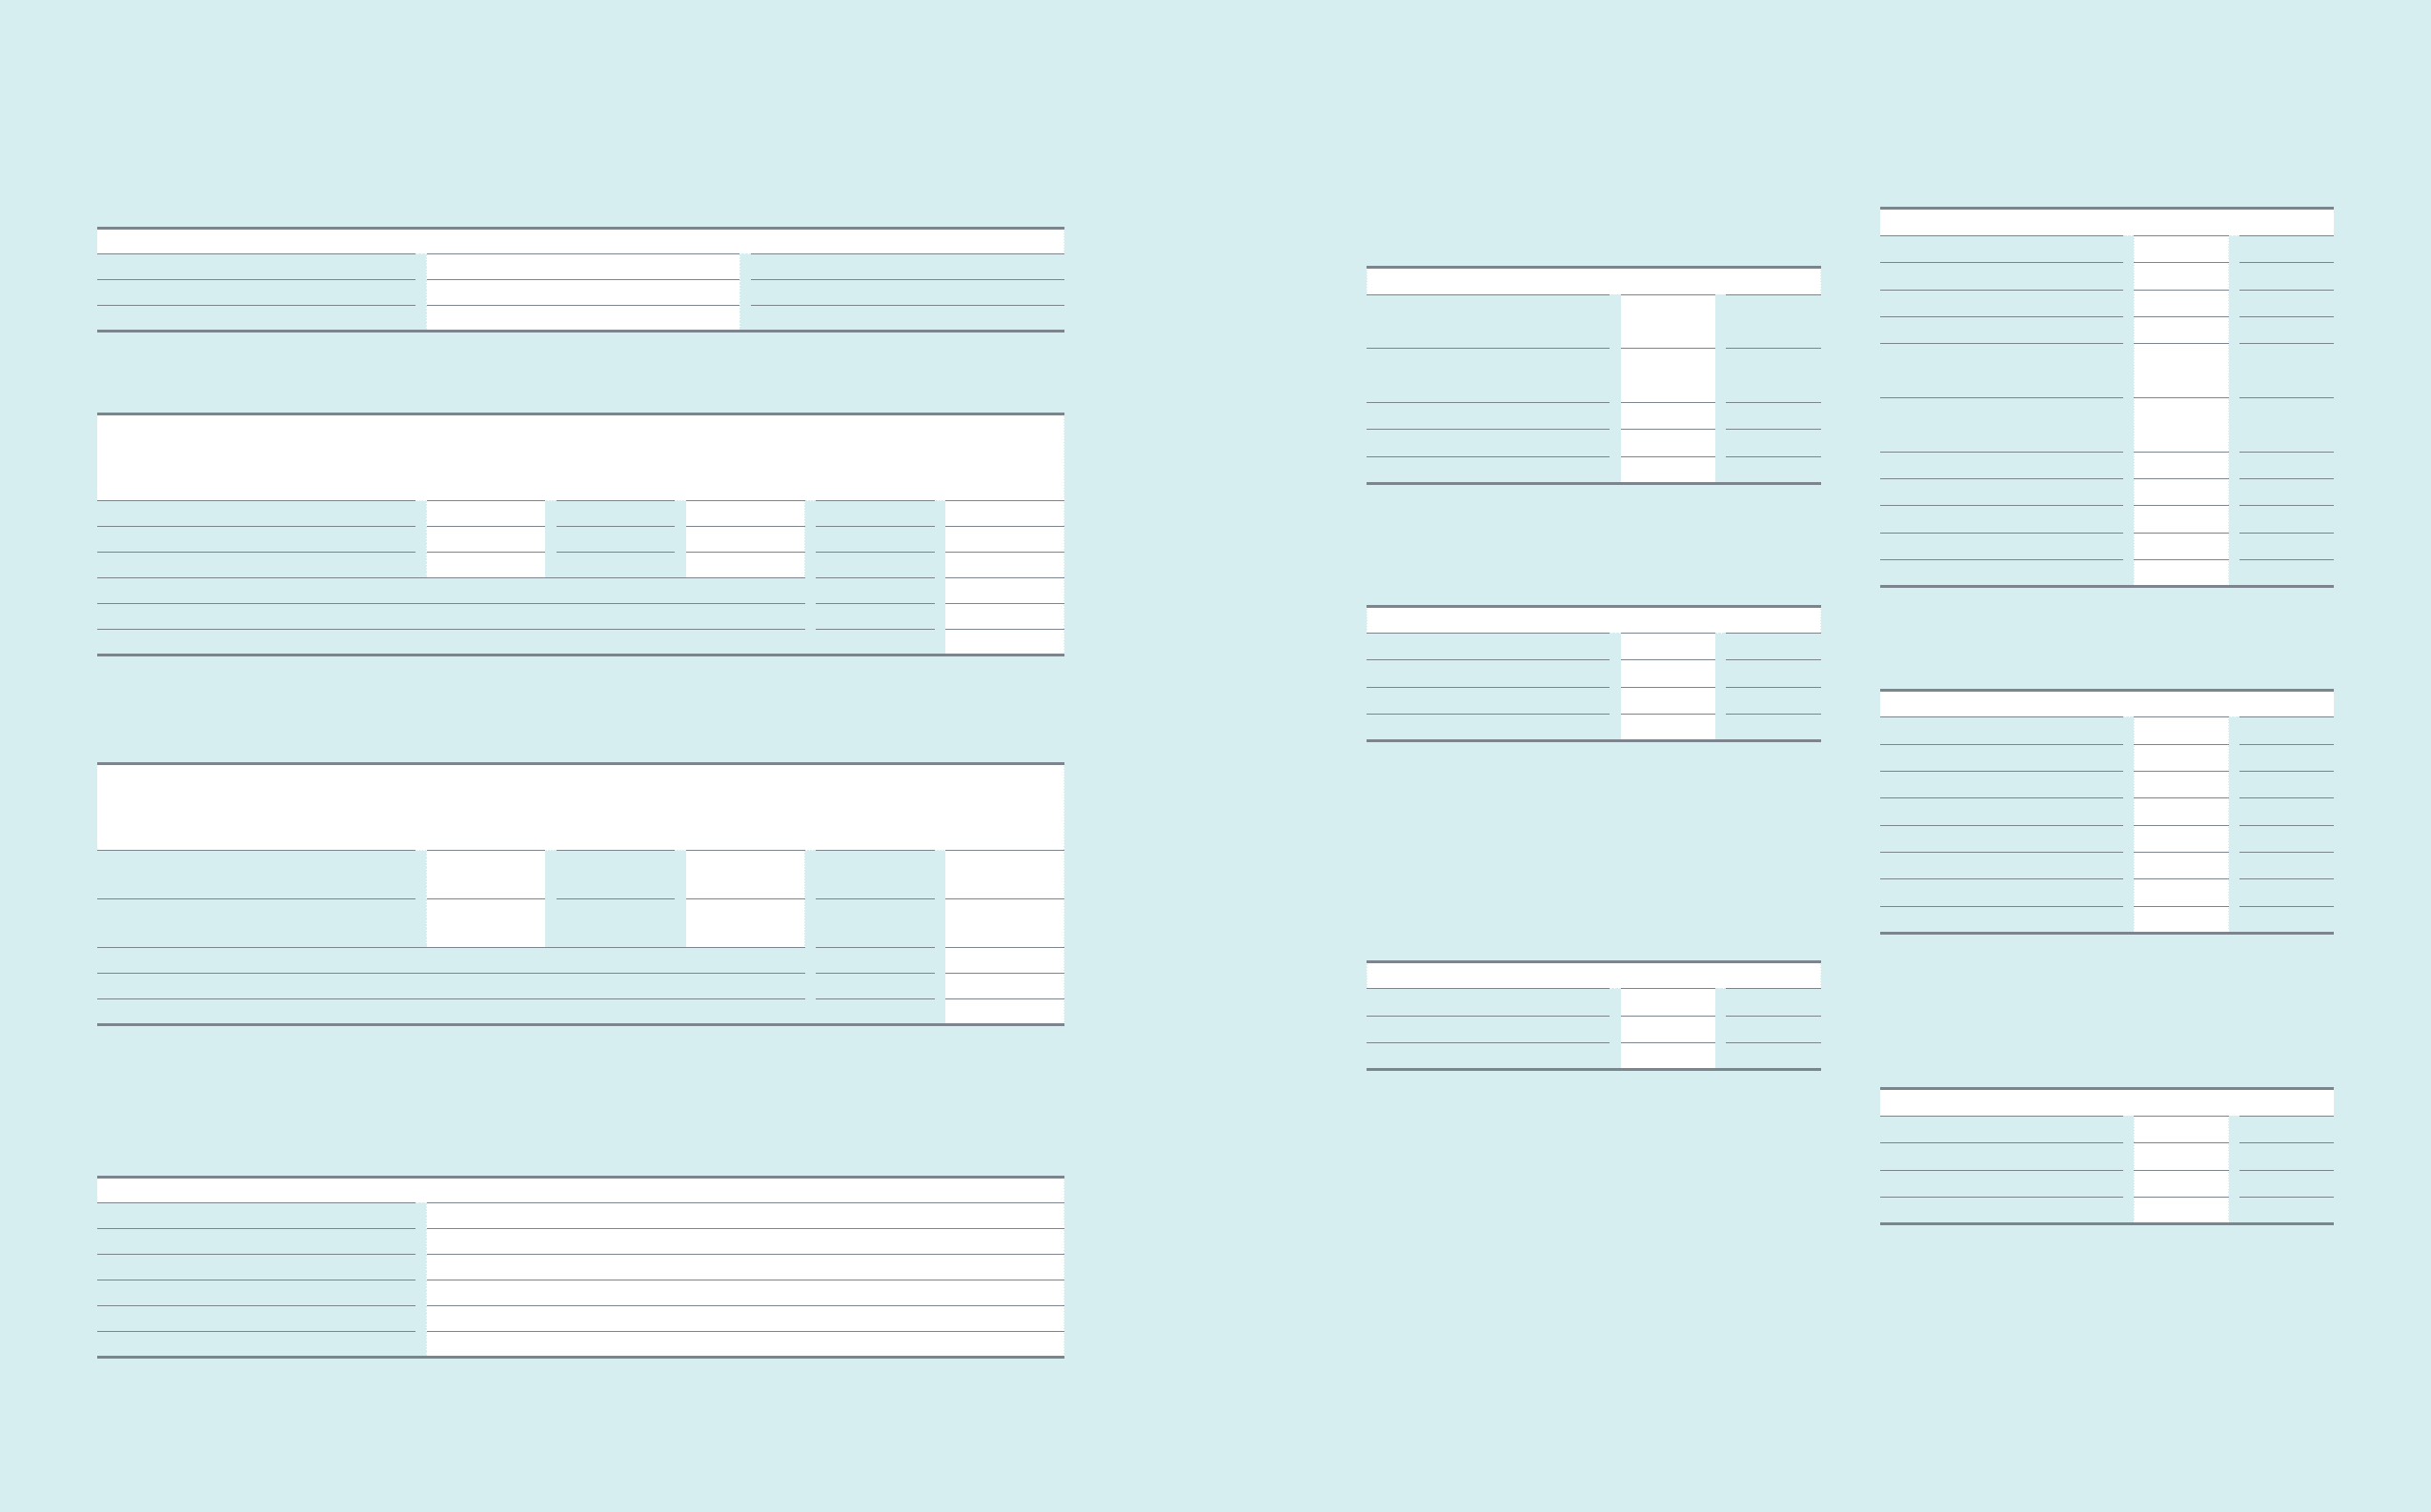
(C) Maturities of debentures outstanding as of December 31, 2013 are as follows:
(In millions of Korean won)
For the Years Ending December 31 Debentures
2014 ₩505,277
2015 5,277
2016 205,277
2017 1,060,577
2018 and thereafter 52,763
Total ₩1,829,171
17. Net Dened Benet Liabilities
(A) Details of net dened benet liabilities recognized on the
statements of nancial position as of December 31, 2013 and 2012,
are as follows:
(In millions of Korean won)
2013 2012
Present value of funded dened benet
obligations ₩5,672,147 ₩4,593,284
Present value of unfunded dened
benet obligations 55,931 76,183
Subtotal 5,728,078 4,669,467
Fair value of plan assets (3,873,176) (2,939,528)
Total ₩1,854,902 ₩1,729,939
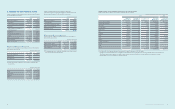
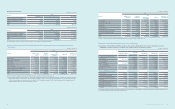
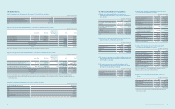
(B) The amounts recognized in the statements of income for the years
ended December 31, 2013 and 2012, are as follows:
(In millions of Korean won)
2013 2012
Current service cost ₩836,916 ₩670,123
Interest cost 82,487 58,591
Others 8,164 8,033
₩927,567 ₩736,747
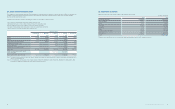
(C) The amounts recognized as cost of dened contribution plan for the
years ended December 31, 2013 and 2012, are ₩44,430 million and
₩31,676 million, respectively.
(D) The pension expenses related to dened benet plans by line
item recognized on the statements of income for the years ended
December 31, 2013 and 2012, are as follows:
(In millions of Korean won)
2013 2012
Cost of sales ₩376,588 ₩291,355
Selling and administrative expenses, etc. 550,979 445,392
₩927,567 ₩736,747
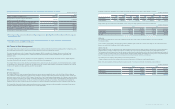
(E) Changes in the dened benet obligations for the years ended
December 31, 2013 and 2012, are as follows:
(In millions of Korean won)
2013 2012
Balance as of January 1 ₩4,669,467 ₩3,542,340
Current service cost 836,916 670,123
Interest cost 226,271 194,625
Remeasurement:
Actuarial gains or losses arising from
changes in demographic assumptions (38) 81,587
Actuarial gains or losses arising from
changes in nancial assumptions (22,870) 473,488
Others 257,724 55,396
Benets paid (244,186) (301,444)
Foreign exchange differences (18,128) (22,028)
Others 22,922 (24,620)
Balance as of December 31 ₩5,728,078 ₩4,669,467
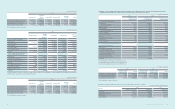
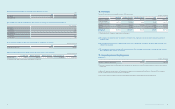
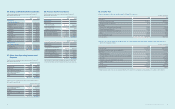
(F) Changes in the fair value of plan assets for the years ended
December 31, 2013 and 2012, are as follows:
(In millions of Korean won)
2013 2012
Balance as of January 1 ₩2,939,528 ₩2,423,152
Expected return on plan assets 143,784 136,034
Remeasurement factor of plan assets (37,343) (47,333)
Contributions by the employer 978,313 595,420
Benets paid (141,017) (155,000)
Foreign exchange differences (3,035) (8,812)
Others (7,054) (3,933)
Balance as of December 31 ₩3,873,176 ₩2,939,528
Expected contributions to post-employment benet plans for the year
ending December 31, 2014, are ₩1,176,458 million.
(G) Plan assets as of December 31, 2013 and 2012, consist of as
follows:
(In millions of Korean won)
2013 2012
Equity instruments ₩ -₩59,988
Debt instruments 3,851,102 2,859,415
Others 22,074 20,125
₩3,873,176 ₩2,939,528
(*) Plan assets are mostly invested in instruments which have a quoted
price in active market.