Samsung 2012 Annual Report Download - page 55
Download and view the complete annual report
Please find page 55 of the 2012 Samsung annual report below. You can navigate through the pages in the report by either clicking on the pages listed below, or by using the keyword search tool below to find specific information within the annual report.-
 1
1 -
2
-
3
-
4
-
5
-
6
-
7
-
8
-
9
-
10
-
11
-
12
-
13
-
14
-
15
-
16
-
17
-
18
-
19
-
20
-
21
-
22
-
23
-
24
-
25
-
26
-
27
-
28
-
29
-
30
-
31
-
32
-
33
-
34
-
35
-
36
-
37
-
38
-
39
-
40
-
41
-
42
-
43
-
44
-
 45
45 -
 46
46 -
 47
47 -
 48
48 -
 49
49 -
 50
50 -
 51
51 -
 52
52 -
 53
53 -
 54
54 -
 55
55 -
 56
56 -
 57
57 -
 58
58 -
 59
59 -
 60
60
 |
 |
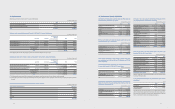
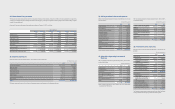
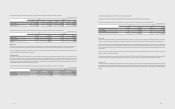
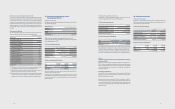
The segment information provided to the Management committee for the reportable segments for the year ended 31 December 2012 and 2011 is as follows:
(In millions of Korean won)
2012
DMC DS
Total (*) Elimination Consolidated
Total (*) CE IM Total (*) Semi
conductor LCD
Total segment
Revenue 347,393,209 111,397,867 231,420,085 136,724,256 66,976,623 69,359,762 479,499,910 (278,396,297) 201,103,613
Inter-segment
Revenue (189,065,192) (62,954,118) (122,914,049) (68,436,962) (32,090,017) (36,360,406) (278,396,297) 278,396,297 -
Revenue from
external
customers
158,328,017 48,443,749 108,506,036 68,287,294 34,886,606 32,999,356 201,103,613 - 201,103,613
Depreciation 1,371,373 565,310 497,607 13,354,303 9,087,880 4,179,088 14,835,046 - 14,835,046
Amortization 376,956 70,370 188,740 274,568 186,497 77,047 786,970 - 786,970
Operating
prot(loss) 21,612,818 2,301,431 19,440,840 7,416,325 4,173,730 3,214,750 29,049,338 - 29,049,338
(*) The total amount includes others not composing operating segments.
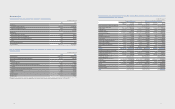
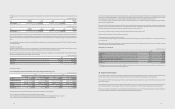
(In millions of Korean won)
2011
DMC DS
Total (*) Elimination Consolidated
Total (*) CE IM Total (*) Semi
conductor LCD
Total segment
Revenue 249,807,647 103,530,319 142,127,410 132,790,577 71,305,465 61,648,667 378,693,504 (213,691,733) 165,001,771
Inter-segment
Revenue (133,588,287) (56,233,694) (74,679,457) (67,015,926) (34,315,914) (32,405,595) (213,691,733) 213,691,733 -
Revenue from
external
customers
116,219,360 47,296,625 67,447,953 65,774,651 36,989,551 29,243,072 165,001,771 - 165,001,771
Depreciation 1,194,509 589,010 356,902 11,732,649 7,678,022 4,027,032 12,934,274 - 12,934,274
Amortization 244,284 57,207 158,394 213,002 143,810 61,943 657,790 - 657,790
Operating
prot(loss) 9,523,446 1,256,788 8,122,626 6,062,934 6,383,875 (347,114) 15,644,291 - 15,644,291
(*) The total amount includes others not composing operating segments.
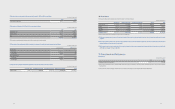
The regional segment information provided to the Management Committee for the reportable segments for the years ended 31 December 2012 and 2011, is as
follows:
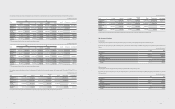
(In millions of Korean won)
2012 Korea America Europe Asia and
Africa China Eliminations Consolidated
Total segment
Revenue 179,434,349 81,440,718 75,448,403 57,246,033 85,930,407 (278,396,297) 201,103,613
Inter-segment
Revenue (150,254,258) (23,277,536) (25,927,742) (21,167,278) (57,769,483) 278,396,297 -
Revenue from
external
customers
29,180,091 58,163,182 49,520,661 36,078,755 28,160,924 - 201,103,613
Non-current
assets (*) 60,591,343 6,890,648 1,030,437 1,749,330 2,574,796 (622,106) 72,214,448
(*) The total of non-current assets other than nancial instruments, deferred tax assets, associates, and interests in joint ventures.
107106
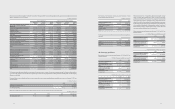
(In millions of Korean won)
2011 Korea America Europe Asia and
Africa China Eliminations Consolidated
Total segment
Revenue 143,717,714 67,967,462 63,096,978 41,853,227 62,058,123 (213,691,733) 165,001,771
Inter-segment
Revenue (117,185,100) (20,441,236) (24,028,163) (13,035,182) (39,002,052) 213,691,733 -
Revenue from
external
customers
26,532,614 47,526,226 39,068,815 28,818,045 23,056,071 - 165,001,771
Non-current
assets (*) 53,864,391 7,157,372 943,800 1,333,012 2,229,989 (129,377) 65,399,187
(*) The total of non-current assets other than nancial instruments, deferred tax assets, associates, and interests in joint ventures.
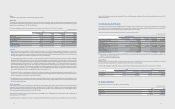
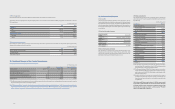
34. Related Parties
(A) Associates
The principal associate companies are Samsung SDI, Samsung Electro-mechanics, Samsung SDS, Samsung Techwin and Samsung card.
Transactions with associates for the years ended December 31, 2012 and 2011 and the related receivables and payables as of December 31, 2012 and 2011, are as
follows:
(In millions of Korean won)
2012 2011
Transactions
Sales ₩806,658 ₩1,695,298
Purchases 9,710,610 8,634,597
Receivables and Payables
Receivables 85,701 225,076
Payables 955,349 1,168,952
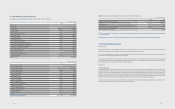
(B) Joint ventures
The principal joint venture company is Samsung Corning Precision Materials as of December 31, 2012.
Transactions with joint venture partners for the years ended December 31, 2012 and 2011, and the related receivablesand payables as of December 31, 2012 and
2011, are as follows:
(In millions of Korean won)
2012 2011
Transactions
Sales ₩35,484 ₩7,195
Purchases 2,800,989 3,210,831
Receivables and Payables
Receivables 878 6,379
Payables 408,885 379,944