Samsung 2012 Annual Report Download - page 44
Download and view the complete annual report
Please find page 44 of the 2012 Samsung annual report below. You can navigate through the pages in the report by either clicking on the pages listed below, or by using the keyword search tool below to find specific information within the annual report.-
 1
1 -
2
-
3
-
4
-
5
-
6
-
7
-
8
-
9
-
10
-
11
-
12
-
13
-
14
-
15
-
16
-
17
-
18
-
19
-
20
-
21
-
22
-
23
-
24
-
25
-
26
-
27
-
28
-
29
-
30
-
31
-
32
-
33
-
 34
34 -
 35
35 -
 36
36 -
 37
37 -
 38
38 -
 39
39 -
 40
40 -
 41
41 -
 42
42 -
 43
43 -
 44
44 -
 45
45 -
 46
46 -
 47
47 -
 48
48 -
 49
49 -
 50
50 -
 51
51 -
 52
52 -
 53
53 -
 54
54 -
55
-
56
-
57
-
58
-
59
-
60
 |
 |

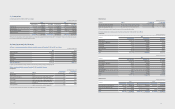
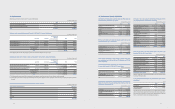
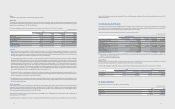
Goodwill impairment reviews are undertaken annually. Impairment tests suggest that, except for Samsung Digital Imaging, the carrying values of cash generating units do
not exceed the recoverable amounts. The recoverable amounts of cash-generating units have been determined based on value-in-use calculations. These calculations use
pre-tax cash ow projections based on nancial budgets approved by management covering a ve-year period. Cash ows beyond the ve-year period are extrapolated
using the estimated growth rates stated below. The growth rate does not exceed the long-term average growth rate for the business in which Samsung Digital Imaging
operates. In addition, a constant growth rate assumption is used for perpetual cash ow calculation.
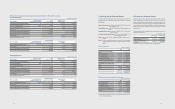
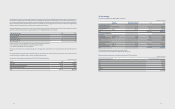
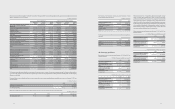
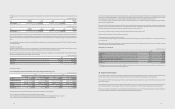
The Digital Imaging Division has posted consecutive decits for several years and is not expected to be protable in the near future so that the Company recognized an
impairment of goodwill. The major assumptions calculating the value in use of the Digital Imaging Division are as followings:
Samsung Digital Imaging 2012 2011
Sales prot margin rate 0.9 2.3
Sales growth rate (*1) 6.7 13.6
Perpetual growth rate (*2) (2.4) 2.1
Pre-tax discount rate (*3) 15.6 13.6
(*1) Future cashow of 5 years are projected based on previous growth rate and the industry estimates.
(*2) The projected growth rate beyond ve years is consistent with industry estimates.
(*3) Pre-tax discount rate applied to the cash ow projections.
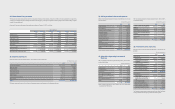
Sales growth rate were determined on the basis of past performance and expectations of market fluctuations. The discount rate reflects the special risk related to the
division.
The carrying value of Samsung Digital Imaging exceeded the value in use by ₩204,600 million in 2012 and ₩183,145 million in 2011 and the amounts have been
recognized as the other non-operating expenses - net in the consolidated income statements.
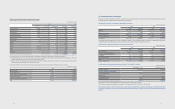
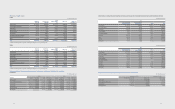
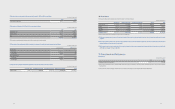
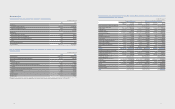
(C) Amortization of intangible assets as of December 31, 2012 and 2011 is classified as follows:
(In millions of Korean won)
Account 2012 2011
Cost of sales ₩327,869 ₩266,101
Selling general and administrative expenses 353,909 300,497
Research and development expenses 105,192 91,192
Total ₩786,970 ₩657,790
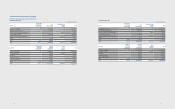
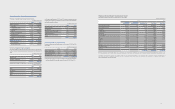
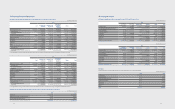
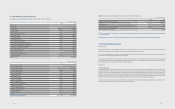
15. Borrowings
(A) Borrowings as of December 31, 2012 and 2011, are as follows:
(In millions of Korean won)
Financial
Institutions
Annual Interest Rates (%)
as of December 31, 2012 2012 2011
Short-term Borrowings
Collateralized borrowings (*1) Shinhan Bank, etc 0.9~5.1 4,328,503 4,878,383
Without collateralized
borrowings BOA etc 0.5~15.1 4,115,249 4,775,339
Total ₩8,443,752 ₩9,653,722
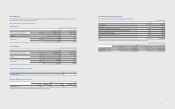
Current Portion of long-term
Borrowings
Bank borrowings MIZUHO Bank, etc 1.6~4.6 480,567 10,820
Financial lease liabilities (*2) APCI, etc 2.2~15.7 13,293 13,936
Total ₩493,860 ₩24,756
Long-term Borrowings
Bank borrowings SMBC, etc 0.7~5.3 ₩3,521,257 ₩3,559,554
Financial lease liabilities (*2) CSSD, etc 2.2~15.7 101,771 122,918
Total ₩3,623,028 ₩3,682,472
(*1) Collateralized borrowings are secured by trade receivables (Note 8).
(*2) Leased property, plant and equipment were pledged as collateral (Note 19).
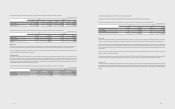
(B) Maturities of long-term borrowings, outstanding as of December 31, 2012, are as follows:
(In millions of Korean won)
For the Years Ending December 31 Long-term borrowings in local currency
2013 ₩493,860
2014 2,583,907
2015 380,722
2016 573,564
Thereafter 84,835
Total ₩4,116,888
8584