Samsung 2012 Annual Report Download - page 40
Download and view the complete annual report
Please find page 40 of the 2012 Samsung annual report below. You can navigate through the pages in the report by either clicking on the pages listed below, or by using the keyword search tool below to find specific information within the annual report.-
 1
1 -
2
-
3
-
4
-
5
-
6
-
7
-
8
-
9
-
10
-
11
-
12
-
13
-
14
-
15
-
16
-
17
-
18
-
19
-
20
-
21
-
22
-
23
-
24
-
25
-
26
-
27
-
28
-
29
-
 30
30 -
 31
31 -
 32
32 -
 33
33 -
 34
34 -
 35
35 -
 36
36 -
 37
37 -
 38
38 -
 39
39 -
 40
40 -
 41
41 -
 42
42 -
 43
43 -
 44
44 -
 45
45 -
 46
46 -
 47
47 -
 48
48 -
 49
49 -
 50
50 -
51
-
52
-
53
-
54
-
55
-
56
-
57
-
58
-
59
-
60
 |
 |
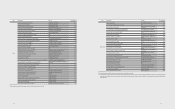
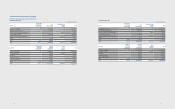
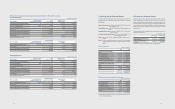
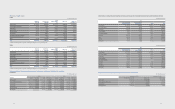
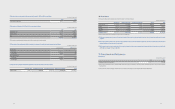
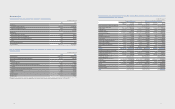
(2) Equity securities-Unlisted (Except for Associates and Joint ventures)
Unlisted equity securities as of December 31, 2012 and 2011 are as follows:
(In millions of Korean won)
2012 2011
Number of
Shares Owned
Percentage
of Ownership (%) Acquisition Cost Book Value Book Value
Kihyup Technology 1,000,000 17.2 ₩5,000 ₩5,000 ₩5,000
Pusan Newport (*1) 1,135,307 1.0 5,677 5,677 5,677
Samsung Venture 980,000 16.3 4,900 6,053 5,835
Samsung Petrochemical 514,172 13.0 8,040 84,427 91,489
Samsung General Chemicals 1,914,251 3.9 19,143 74,487 71,365
icube Investment 40 16.2 4,000 4,000 4,000
Maltani Lighting 9,000 15.0 16,544 16,225 -
SK Telink 14,609 1.1 4,357 4,357 4,357
CSOT (*2) - 15.0 278,130 278,130 278,130
Nanosys 13,100,436 13.0 17,861 17,861 17,861
OpenX 8,899,172 3.5 10,738 10,738 -
Voltaix 7,785 5.8 13,671 13,671 -
Others (*3) - - 157,934 146,699 140,025
₩545,995 ₩667,325 ₩623,739
(*1) As of December 31, 2012, the Company’s investments in Pusan Newport are pledged as collateral against the investee's debt (Note 19).
(*2) Nonmarketable shares are measured at cost because the variation of reasonable fair value estimates is not insignicant and the probabilities of the various
estimates and applicable discount rate cannot be reasonably assessed (Note 32).
(*3) Impairment losses on unlisted equity securities resulting from the decline in realizable value below the acquisition cost amounted to₩2,235 million and₩39
million for the year ended December 31, 2012 and 2011, respectively.
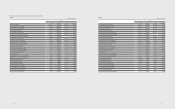
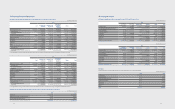
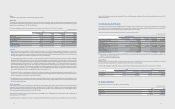
For the years ended December 31, 2012 and 2011, changes in valuation gain (loss) on long-term available-for-sale nancial assets are as follows:
(In millions of Korean won)
2012 2011
Balance at January 1 ₩1,367,331 ₩2,058,189
Fair value gains (losses) 1,176,383 (565,800)
Net gains (losses) transferred from equity 29,041 (125,058)
Balance at December 31 2,572,755 1,367,331
Deferred income tax and minority interest (577,945) (331,008)
Total ₩1,994,810 ₩1,036,323
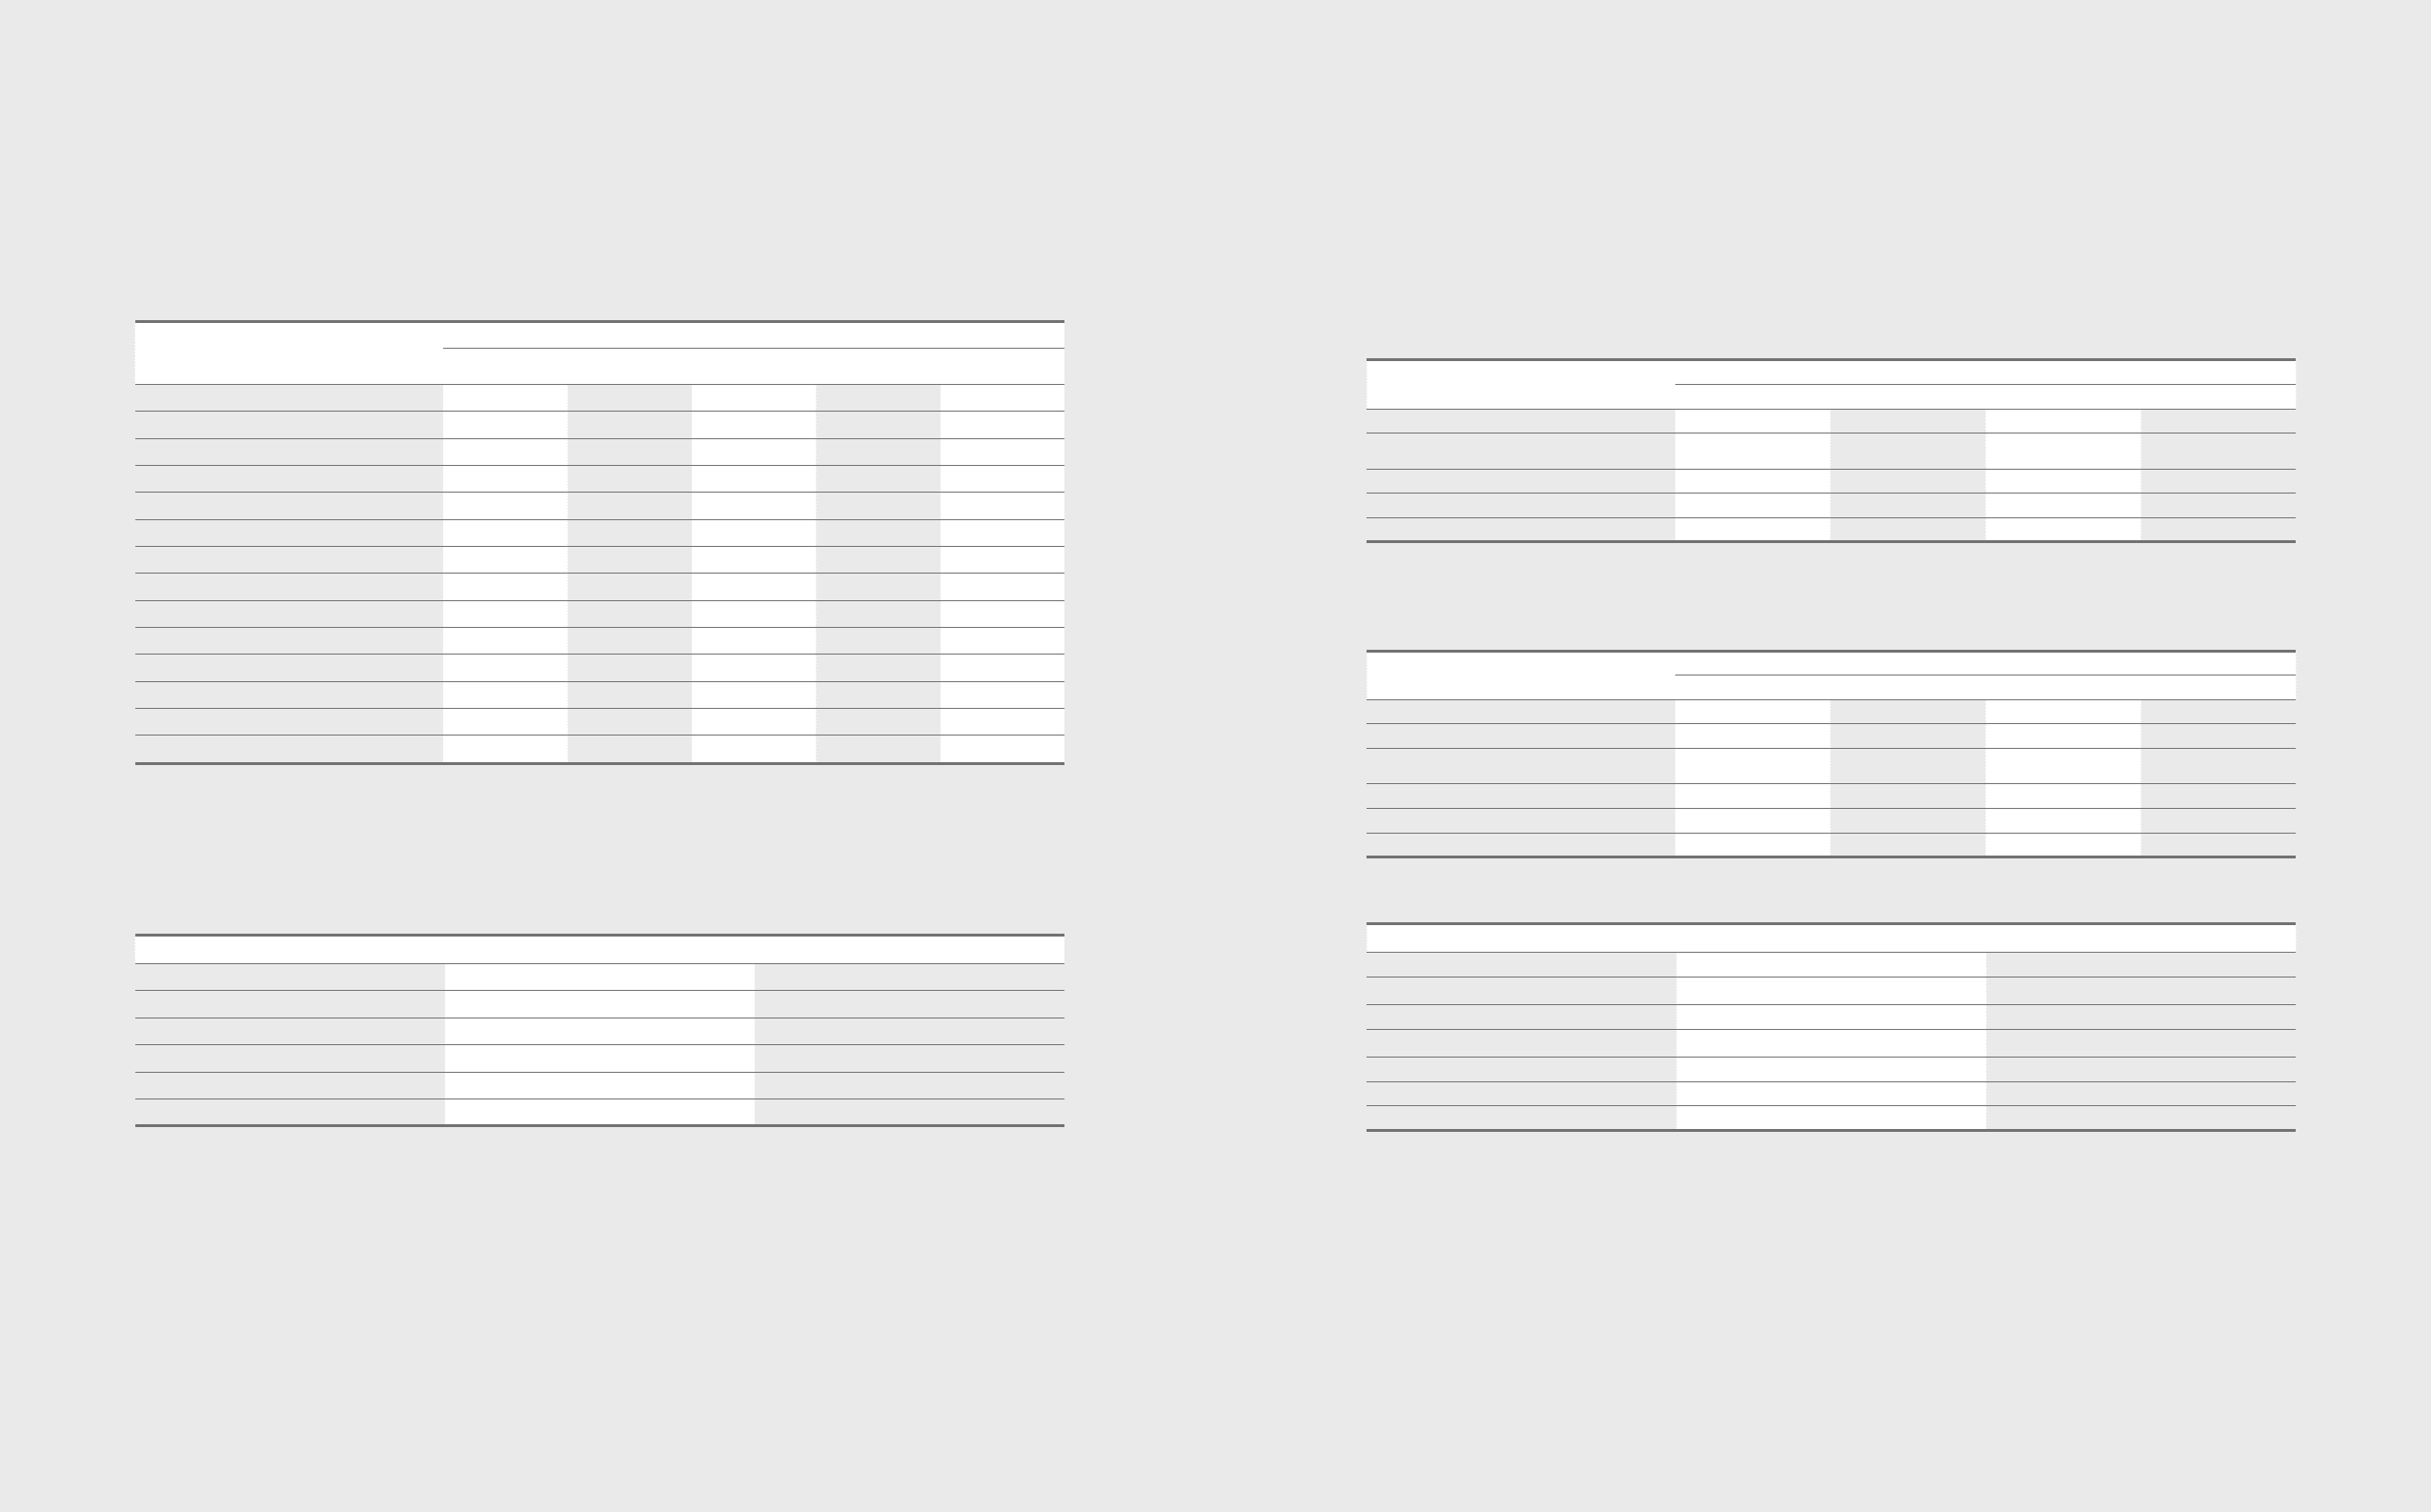
10. Trade and other receivables
All current trade and other receivables are due within 1 year from the end of the reporting period. The carrying amount is a reasonable approximation of fair value for
current trade and other receivables, with the eect of discounting being insignicant.
(A) Trade and other receivables as of December 31, 2012 and 2011, are as follows:
(In millions of Korean won)
2012 2011
Trade Non-Trade Trade Non-Trade
Receivables ₩24,168,427 ₩2,834,187 ₩22,133,741 ₩2,311,996
Less:
Allowances for impairment (276,787) (2,595) (214,597) (37,833)
Trade receivables, net ₩23,891,640 ₩2,831,592 ₩21,919,144 ₩2,274,163
Less: Non-current portion (30,405) (18,231) (37,017) (3,262)
Current portion ₩23,861,235 ₩2,813,361 ₩21,882,127 ₩2,270,901
The Company transferred receivable balances to nancial institutions in exchange for cash. The outstanding balances of transferred receivable balances amounting to
₩4,328,503 million and ₩4,878,383 million have been accounted for as borrowings as of December 31, 2012 and 2011 (Note 15).
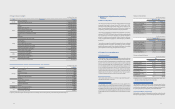
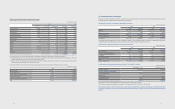
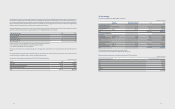
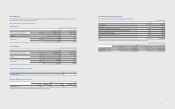
(B) Movements on the provision for impairment of trade receivables are as follows:
(In millions of Korean won)
2012 2011
Trade Non-Trade Trade Non-Trade
Balance on January 1 ₩(214,597) ₩(37,833) ₩(185,758) ₩(19,585)
Provision for receivables impairment (181,751) (20,351) (78,202) (11,478)
Receivables written o during the year as
uncollectible 18,752 28,203 7,345 224
Unused amounts reversed 98,163 26,721 56,539 11,561
Others 2,646 665 (14,521) (18,555)
Balance on December 31 ₩(276,787) ₩(2,595) ₩(214,597) ₩(37,833)
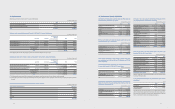
(C) An aging analysis of trade and other receivables as of December 31, 2012 and 2011, is as follows:
(In millions of Korean won)
December 31, 2012 December 31, 2011
Receivables not past due ₩ 24,151,060 22,467,108
Receivables past due, not impaired (*1):
Less than 31 days overdue 2,226,759 1,351,566
Bad debts (*2):
31 days to 90 days overdue 231,343 339,107
90 days overdue or more 393,452 287,956
27,002,614 24,445,737
(*1) The Company does not consider receivables that are overdue for less than or equal to 31 days as impaired.
(*2) The balance of allowance for doubtful debts as of December 31, 2012 amounts to ₩ 279,382 million (2011: ₩ 252,430 million).
(D) The maximum exposure to credit risk at the reporting date is the carrying value of each class of receivable mentioned above. As of December 31, 2012, the
Company has credit insurance with Korea Trade Insurance and overseas insurance companies against its export accounts receivables from approved foreign
customers.
7776