Samsung 2012 Annual Report Download - page 49
Download and view the complete annual report
Please find page 49 of the 2012 Samsung annual report below. You can navigate through the pages in the report by either clicking on the pages listed below, or by using the keyword search tool below to find specific information within the annual report.-
 1
1 -
2
-
3
-
4
-
5
-
6
-
7
-
8
-
9
-
10
-
11
-
12
-
13
-
14
-
15
-
16
-
17
-
18
-
19
-
20
-
21
-
22
-
23
-
24
-
25
-
26
-
27
-
28
-
29
-
30
-
31
-
32
-
33
-
34
-
35
-
36
-
37
-
38
-
 39
39 -
 40
40 -
 41
41 -
 42
42 -
 43
43 -
 44
44 -
 45
45 -
 46
46 -
 47
47 -
 48
48 -
 49
49 -
 50
50 -
 51
51 -
 52
52 -
 53
53 -
 54
54 -
 55
55 -
 56
56 -
 57
57 -
 58
58 -
 59
59 -
60
 |
 |
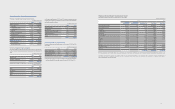
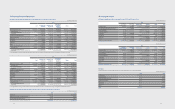
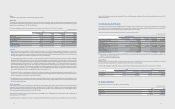
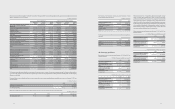
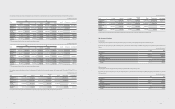
24. Share Based Compensation
The Company has a stock option plan that provides for the granting of stock purchase options to employees or directors who have contributed or are expected to
contribute to the management and technological innovation of the Company. No share based compensation has been granted since December 20, 2005. All options
currently in issue are fully vested.
A summary of the terms and the number of outstanding stock options as of December 31, 2012 is as follows:
Date of the Grant
March 9,
2001
February 28,
2002
March 25,
2002
March 7,
2003
April 16,
2004
December 20,
2005
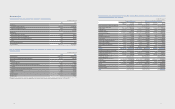
At January 1, 2011 176,072 160,221 30,975 74,875 344,568 10,000
Exercised during 2011 176,072 112,626 28,046 25,624 143,282 -
At December 31, 2011 47,595 2,929 49,251 201,286 10,000
Exercised During 2012 - 47,595 2,929 33,404 102,381 5,000
At December 31, 2012 - - - 15,847 98,905 5,000
Exercise price ₩197,100 ₩329,200 ₩342,800 ₩288,800 ₩580,300 ₩606,700
Weighted average share price at the date of
exercise during 2011 ₩943,994 ₩949,456 ₩931,977 ₩935,942 ₩998,175 ₩-
Weighted average share price at the date of
exercise during 2012 ₩-₩1,102,409 ₩1,154,394 ₩1,308,176 ₩1,276,208 ₩1,404,000
Exercise period from the date of the grant 3-10 years 2-10 years 2-10 years 2-10 years 2-10 years 2-10 years
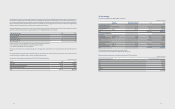
25. Expenses by Nature
Expenses by nature for the years ended December 31, 2012 and 2011 consist of the following:
(In millions of Korean won)
2012 2011
Raw materials and goods ₩85,193,865 ₩75,329,188
Wages and salaries 13,629,400 11,906,674
Pension expenses 768,423 584,096
Depreciation expenses 14,835,046 12,934,274
Amortization expenses 786,970 657,790
Welfare expenses 2,481,756 1,998,559
Commission and service charges 6,961,701 5,936,770
Other expenses 47,397,114 40,010,129
Total (*) ₩172,054,275 ₩149,357,480
(*) Expenses above equal to the sum of cost of sales, selling, general and administrative expenses in the Statements of Income.
9594
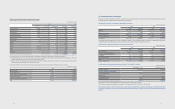
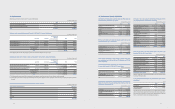
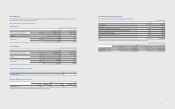
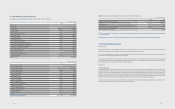
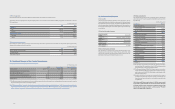
26. Selling and Administrative Expenses
Selling and administrative expenses for the years ended December 31, 2012 and
2011, are as follows:
(In millions of Korean won)
2012 2011
Wages and salaries ₩4,032,848 ₩3,551,588
Pension expenses 204,929 140,587
Commission and service charges 6,961,701 5,936,770
Depreciation expenses 442,080 368,123
Amortization expenses 353,909 300,497
Advertising expenses 4,887,089 2,982,270
Sales promotion expenses 6,055,105 4,649,293
Transportation expenses 3,794,950 3,789,476
Warranty 3,247,757 2,805,696
Public relation expenses 627,901 523,149
Research and development expenses 11,532,795 9,955,164
Others 3,261,280 2,209,747
₩45,402,344 ₩37,212,360
27. Other Non-Operating Income and
Expense
Other non-operating income for the years ended December 31, 2012 and 2011,
consists of the following:
(In millions of Korean won)
2012 2011
Dividend income ₩106,181 ₩34,423
Commission income 100,535 26,313
Rental income 98,462 92,155
Gain on disposal of investments 113,886 223,535
Gain on disposal of property, plant and
equipment 147,645 113,690
Gain on disposal of business (*) - 1,062,793
Others 986,280 698,110
₩1,552,989 ₩2,251,019
(*) Gain on disposal of business in 2011 relates to sales of the Solar battery
business and the HDD business.
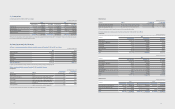
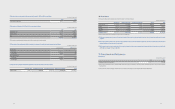
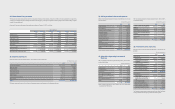
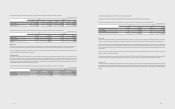
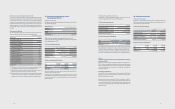
Other non-operating expense for the years ended December 31, 2012 and 2011,
consists of the following:
(In millions of Korean won)
2012 2011
Loss from disposal of property, plant and
equipment ₩324,993 ₩109,338
Donations 235,349 272,275
Impairment losses on intangible assets 216,790 186,759
Impairment losses on property, plant and
equipment 215,325 97,517
Impairment losses on available-for-sale
nancial assets 87,515 39
Others 496,053 946,762
₩1,576,025 ₩1,612,690
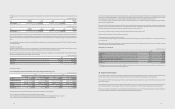
28. Financial Income and Costs
Financial income and costs for the years ended December 31, 2012 and 2011 are
as follows:
(In millions of Korean won)
2012 2011
Finance income
Interest income ₩845,431 ₩705,653
- Interest income from loans and
receivables 840,150 702,198
- Interest income from available-for-
sale nancial assets 5,281 3,455
Foreign exchange dierences 6,452,612 6,120,748
Gains on valuation of derivatives 27,719 80,103
Gains on derivatives transaction 510,792 497,021
₩7,836,554 ₩7,403,525
Finance expense
Interest expense ₩599,006 ₩644,133
- Interest expense from nancial
liabilities measured at amortized
cost
277,512 270,929
- Other nancial liabilities 321,494 373,204
Foreign exchange dierences 6,596,524 6,785,565
Losses on valuation of derivatives 124,344 59,697
Losses on derivatives transaction 614,576 404,026
₩7,934,450 ₩7,893,421
The Company recognizes foreign exchange gains and losses arising from foreign
currency transactions and translation as nancial income and expenses.