Samsung 2012 Annual Report Download - page 38
Download and view the complete annual report
Please find page 38 of the 2012 Samsung annual report below. You can navigate through the pages in the report by either clicking on the pages listed below, or by using the keyword search tool below to find specific information within the annual report.-
 1
1 -
2
-
3
-
4
-
5
-
6
-
7
-
8
-
9
-
10
-
11
-
12
-
13
-
14
-
15
-
16
-
17
-
18
-
19
-
20
-
21
-
22
-
23
-
24
-
25
-
26
-
27
-
 28
28 -
 29
29 -
 30
30 -
 31
31 -
 32
32 -
 33
33 -
 34
34 -
 35
35 -
 36
36 -
 37
37 -
 38
38 -
 39
39 -
 40
40 -
 41
41 -
 42
42 -
 43
43 -
 44
44 -
 45
45 -
 46
46 -
 47
47 -
 48
48 -
49
-
50
-
51
-
52
-
53
-
54
-
55
-
56
-
57
-
58
-
59
-
60
 |
 |
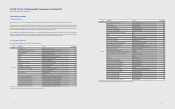
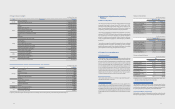
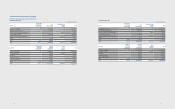
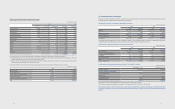
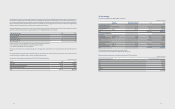
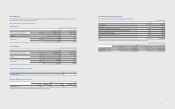
(B) Income and loss of financial instruments by category for the years ended December 31, 2012 and 2011, are as follows:
(1) As of December 31, 2012
(In millions of Korean won)
Financial Assets Assets at fair value
through the prot and loss
Loans
and receivables
Available-for-sale
nancial assets Total
Gain on valuation (Other comprehensive gain) ₩-₩-₩1,185,256 ₩1,185,256
Gain/(Loss) on valuation/disposal (74,609) 28,915 105,192 59,498
Gain on disposal (Reclassication) - - 23,072 23,072
Interest income - 840,150 5,281 845,431
Foreign exchange dierences (Financial income) - 2,213,693 - 2,213,693
Foreign exchange dierences (Financial expense) - (2,569,682) - (2,569,682)
Dividend income - - 106,181 106,181
Impairment/Reversal (Prot or loss) - - (94,466) (94,466)
Financial Liabilities Liabilities at fair value
through the prot and loss
Financial liabilities
measured at amortized
cost
Other Financial
Liabilities Total
Loss on valuation/disposal (Prot or loss) ₩(125,553) ₩-₩-₩(125,553)
Interest expense - 277,512 321,494 599,006
Foreign exchange dierences (Financial income) - 4,037,004 43,909 4,080,913
Foreign exchange dierences (Financial expense) - (4,019,066) - (4,019,066)
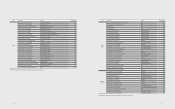
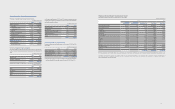
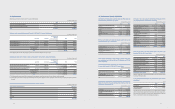
(2) As of December 31, 2011
(In millions of Korean won)
Financial Assets Assets at fair value
through the prot and loss
Loans
and receivables
Available-for-sale
nancial assets Total
Loss on valuation (Other comprehensive loss) ₩-₩-₩(559,831) ₩(559,831)
Gain on valuation/disposal 113,401 - 102,350 215,751
Gain on disposal (Reclassication) - - 134,202 134,202
Interest income - 702,198 3,455 705,653
Foreign exchange dierences (Financial income) - 4,025,356 - 4,025,356
Foreign exchange dierences (Financial expense) - (4,481,568) (2,924) (4,484,492)
Dividend income - - 34,423 34,423
Impairment/Reversal (Prot or loss) - - (39) (39)
Financial Liabilities Liabilities at fair value
through the prot and loss
Financial liabilities
measured at amortized
cost
Other Financial
Liabilities Total
Loss on valuation/disposal (Prot or loss) ₩(1,865) ₩-₩-₩(1,865)
Interest expense - 270,929 373,204 644,133
Foreign exchange dierences (Financial income) - 2,056,604 38,788 2,095,392
Foreign exchange dierences (Financial expense) -(2,288,844) (12,229) (2,301,073)
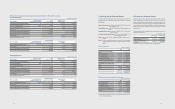
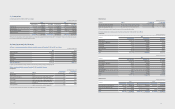
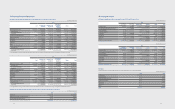
7. Credit Quality of Financial Assets
The credit quality of financial assets that are neither past due nor impaired is
assessed by reference to external credit ratings as of December 31, 2012 and
2011 as follows:
Superior ability to repay - Aaa~Aa (Moody’s), AAA~AA (S&P, Fitch), A1 (Credit
rating agencies in Korea)
Strong ability to repay - A (Moody's), A (S&P, Fitch), A2 (Credit rating agencies in
Korea)
Acceptable ability to repay - Baa (Moody’s), BBB (S&P, Fitch), A3 (Credit rating
agencies in Korea)
Currently having the ability to repay - Ba~B (Moody’s), BB~B (S&P, Fitch), B
(Credit rating agencies in Korea)
Group 1 - Customers with the trade payables guaranteed by credit insurance or
collateral
Group 2 - Customers experienced impairment of capital. As the trade payables
are guaranteed by credit insurance or collateral, all default risk has been
relieved
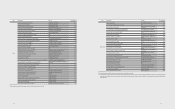
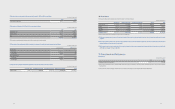
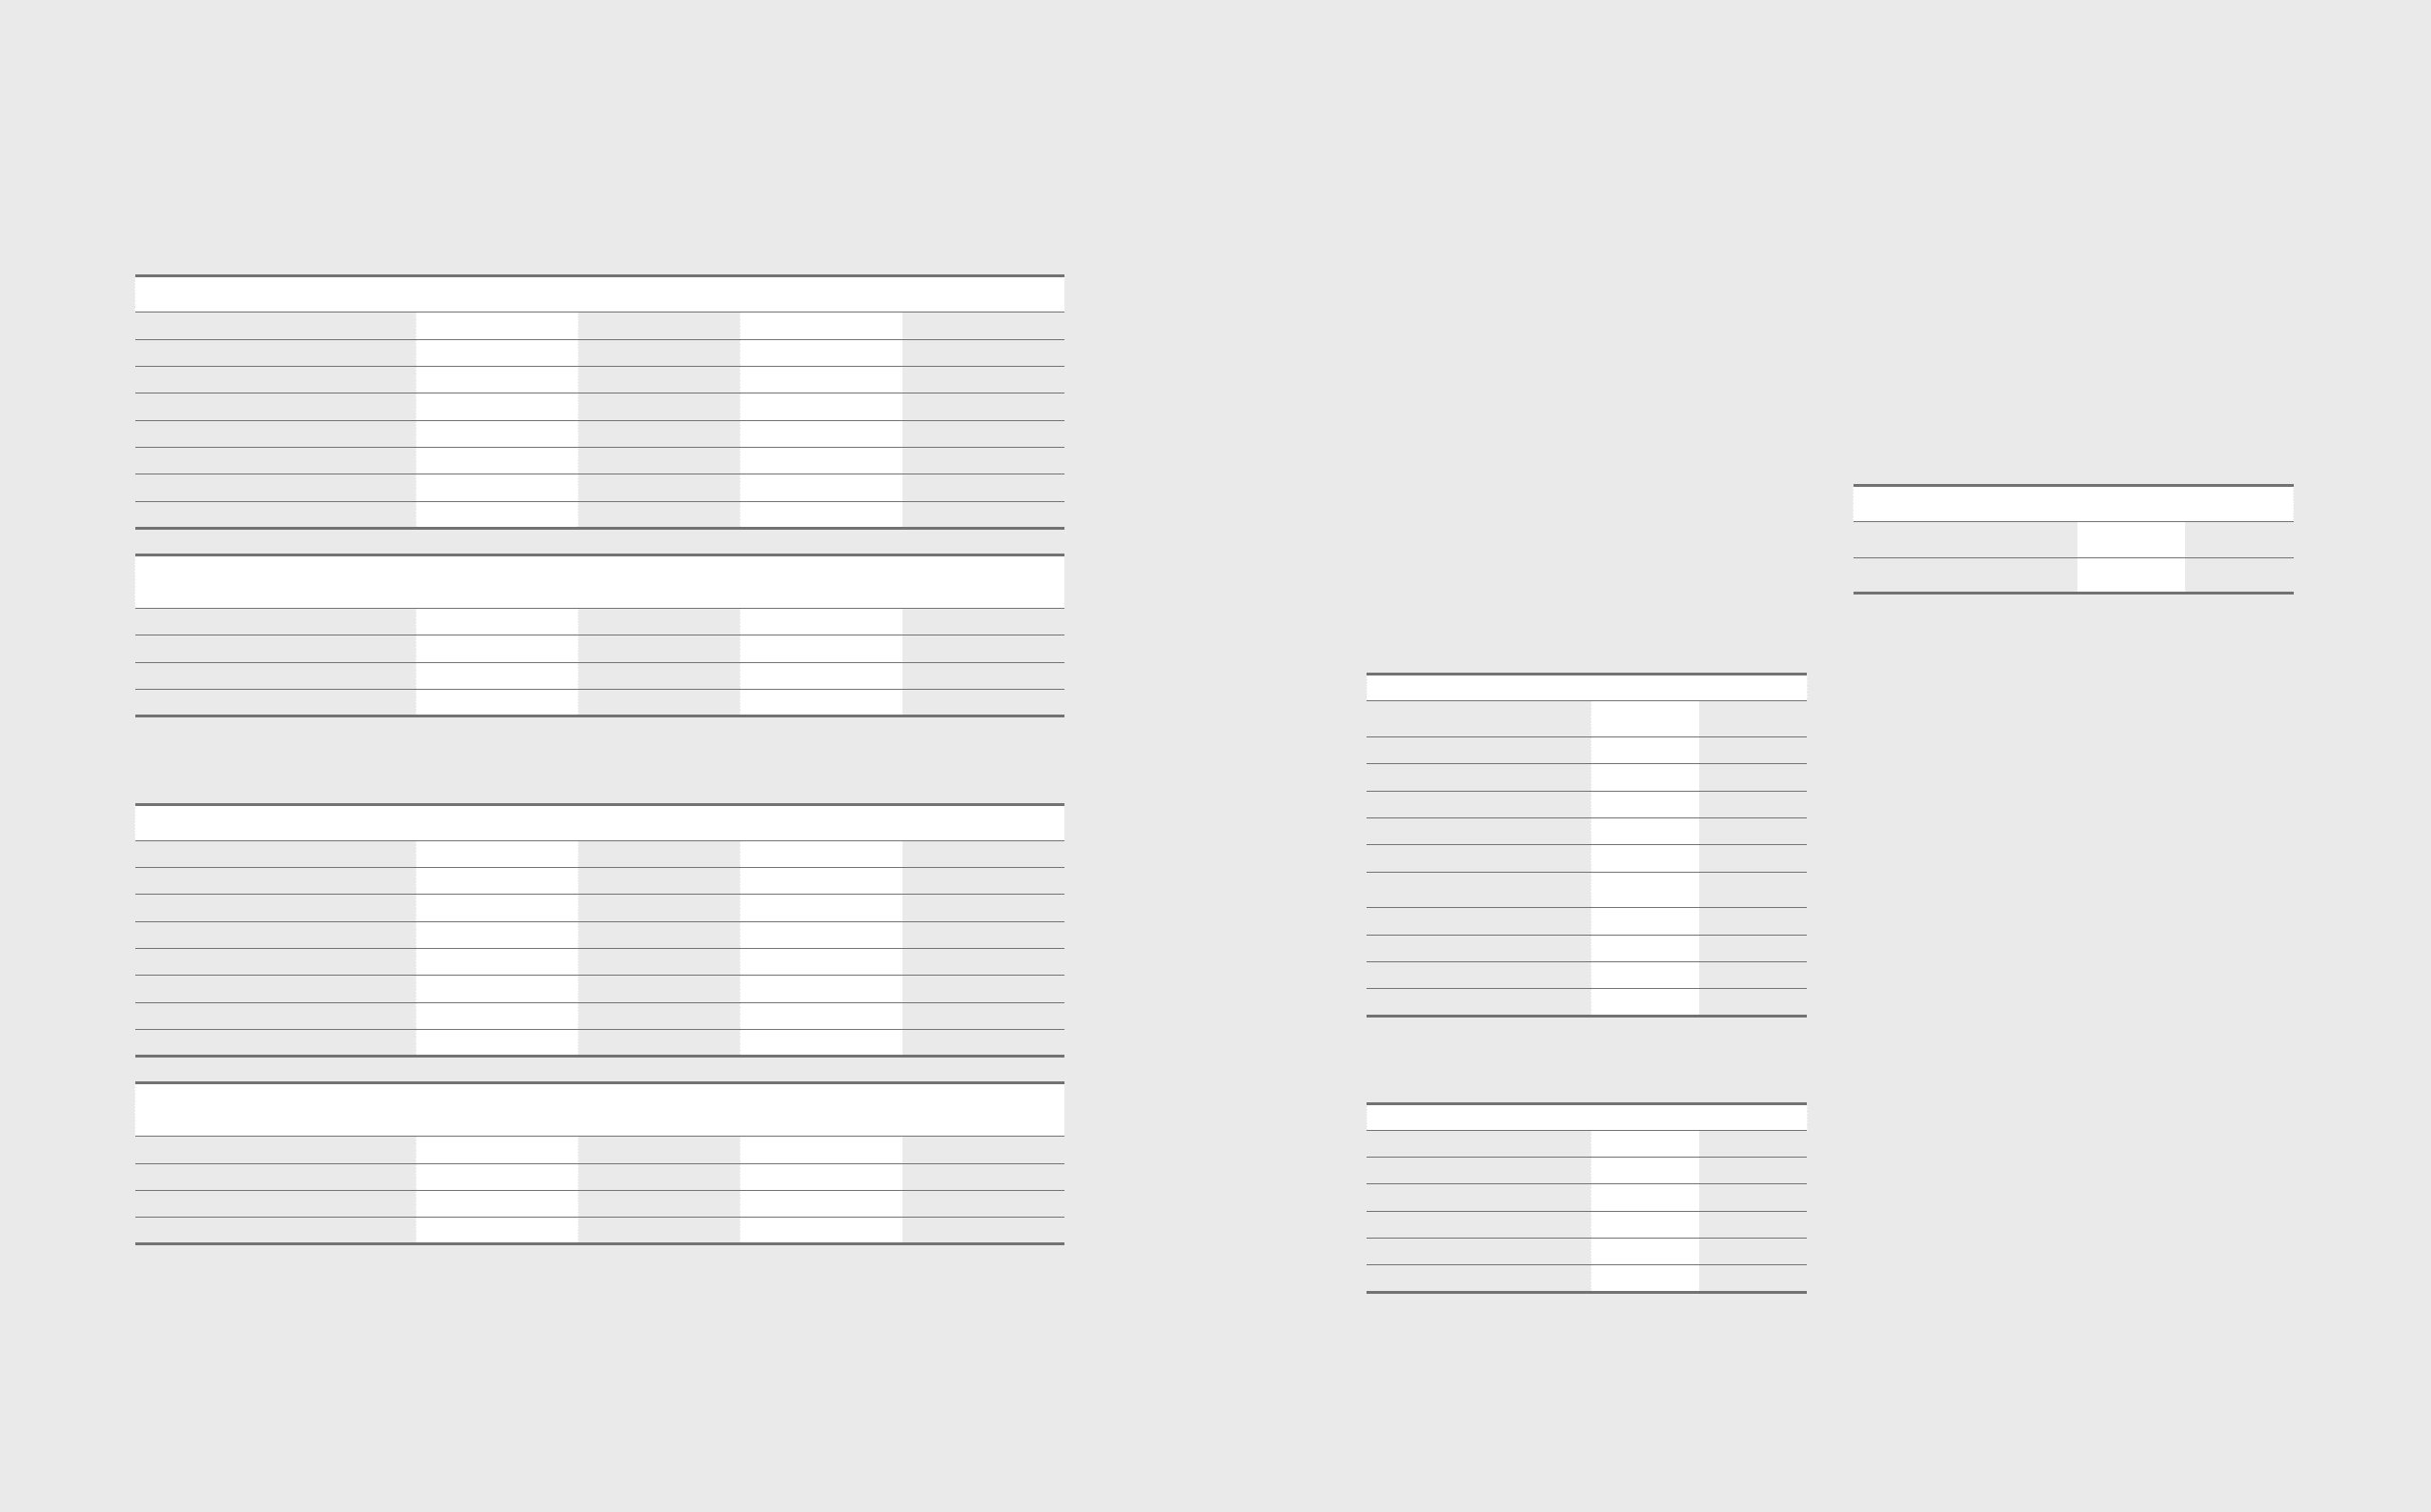
(A) Accounts receivables
(In millions of Korean won)
2012 2011
Counterparties with external credit
rating
Superior ability to repay ₩1,818,158 ₩1,983,246
Strong ability to repay 3,742,515 3,813,989
Acceptable ability to repay 3,217,663 2,981,747
Currently having the ability to repay 3,834,957 2,857,491
₩12,613,293 ₩11,636,473
Counterparties without external credit
rating
Group 1 8,680,397 8,658,198
Group 2 50,160 67,456
₩8,730,557 ₩8,725,654
₩21,343,850 ₩20,362,127
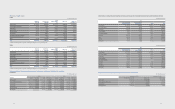
(B) Cash equivalents and short-term financial instruments
(In millions of Korean won)
2012 2011
Superior ability to repay 2,850,476 1,378,015
Strong ability to repay 32,675,712 24,448,843
Acceptable ability to repay 505,631 278,216
Currently having the ability to repay 12,896 15,397
Others (*) 131,782 85,153
₩36,176,497 ₩26,205,624
(*) Short-term nancial instruments at nancial institutions (Credit union etc.)
without external credit rating.
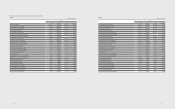
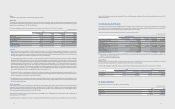
8. Transfers of Financial Assets
Trade receivables have been discounted through factoring agreements with
banks. Collateral (trade receivables and other) provided in transactions of
discount and factoring of trade receivables do not meet the requirements for
asset derecognition as risks and rewards are not substantially transferred in the
event the debtor defaults. Financial liabilities recognized in relation to these
transactions are included as short-term borrowings in the statement of nancial
position (Note 15).
The following table presents a break down of discounted trade receivables as of
December 31, 2012 and 2011:
(In millions of Korean won)
December 31,
2012
December 31,
2011
Carrying amount of the discounted
trade receivables (*) ₩4,328,503 ₩4,878,383
Carrying amount of the related
borrowing ₩4,328,503 ₩4,878,383
(*) The discounted trade receivables include intercompany balances.
7372