Samsung 2012 Annual Report Download - page 26
Download and view the complete annual report
Please find page 26 of the 2012 Samsung annual report below. You can navigate through the pages in the report by either clicking on the pages listed below, or by using the keyword search tool below to find specific information within the annual report.-
 1
1 -
2
-
3
-
4
-
5
-
6
-
7
-
8
-
9
-
10
-
11
-
12
-
13
-
14
-
15
-
 16
16 -
 17
17 -
 18
18 -
 19
19 -
 20
20 -
 21
21 -
 22
22 -
 23
23 -
 24
24 -
 25
25 -
 26
26 -
 27
27 -
 28
28 -
 29
29 -
 30
30 -
 31
31 -
 32
32 -
 33
33 -
 34
34 -
 35
35 -
 36
36 -
37
-
38
-
39
-
40
-
41
-
42
-
43
-
44
-
45
-
46
-
47
-
48
-
49
-
50
-
51
-
52
-
53
-
54
-
55
-
56
-
57
-
58
-
59
-
60
 |
 |

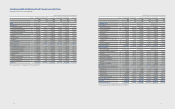
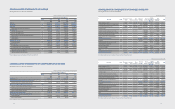
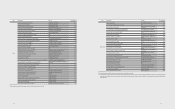
(In millions of Korean won, in thousands of U.S dollars (Note 2.28))
For the year ended December 31,
Notes 2012 2011 2012 2011
KRW KRW USD USD
Revenue 201,103,613 165,001,771 187,754,283 154,048,895
Cost of sales 25 126,651,931 112,145,120 118,244,730 104,700,887
Gross prot 74,451,682 52,856,651 69,509,553 49,348,008
Selling, general and administrative expenses 25, 26 45,402,344 37,212,360 42,388,520 34,742,191
Operating prot 29,049,338 15,644,291 27,121,033 14,605,817
Other non-operating income 27 1,552,989 2,251,019 1,449,901 2,101,596
Other non-operating expense 27 1,576,025 1,612,690 1,471,408 1,505,639
Share of prot or loss of associates and joint ventures 12 986,611 1,399,194 921,119 1,306,315
Finance income 28 7,836,554 7,403,525 7,316,361 6,912,076
Finance expense 28 7,934,450 7,893,421 7,407,758 7,369,453
Prot before income tax 29,915,017 17,191,918 27,929,248 16,050,712
Income tax expense 29 6,069,732 3,432,875 5,666,822 3,204,999
Prot for the year 23,845,285 13,759,043 22,262,426 12,845,713
Prot attributable to owners of the parent 23,185,375 13,382,645 21,646,322 12,494,300
Prot attributable to non-controlling interests 659,910 376,398 616,104 351,413
Earnings per share for prot attributable to the owners of the parent 30
- Basic (in Korean won and US dollars) 154,020 89,229 143.80 83.31
- Diluted (in Korean won and US dollars) 153,950 89,146 143.73 83.23
The accompanying notes are an integral part of these nancial statements.
CONSOLIDATED STATEMENTS OF INCOME
Samsung Electronics Co., Ltd. and its subsidiaries
(In millions of Korean won, in thousands of U.S dollars (Note 2.28))
For the year ended December 31,
Notes 2012 2011 2012 2011
KRW KRW USD USD
Prot for the year 23,845,285 13,759,043 22,262,426 12,845,713
Items not to be reclassied subsequently to prot or loss :
Remeasurement eect of employee benet, net of tax (504,120) (385,214) (470,656) (359,643)
Items to be reclassied subsequently to prot or loss : 17, 23
Changes in value of available-for-sale nancial assets, net of tax 23 962,184 (572,028) 898,314 (534,057)
Share of associates and joint ventures, net of tax 23 (350,491) (113,898) (327,225) (106,337)
Foreign currency translation, net of tax 23 (1,824,653) 183,655 (1,703,532) 171,463
Consolidated comprehensive income 22,128,205 12,871,558 20,659,327 12,017,139
Consolidated comprehensive income attributable to :
Owners of the parent 21,499,343 12,439,116 20,072,209 11,613,403
Non-controlling interests 628,862 432,442 587,118 403,736
The accompanying notes are an integral part of these nancial statements.
CONSOLIDATED STATEMENTS OF COMPREHENSIVE INCOME
Samsung Electronics Co., Ltd. and its subsidiaries
4948
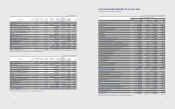
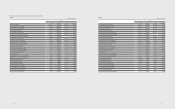
CONSOLIDATED STATEMENTS OF CHANGES IN EQUITY
Samsung Electronics Co., Ltd. and its subsidiaries
(In millions of Korean won)
2011 KRW Notes Preferred
stock
Common
stock
Share
premium
Retained
earnings
Other
reserves
Equity
attributable
to owners of
the parent
Non-
controlling
interests
Total
Balance at January 1, 2011 119,467 778,047 4,403,893 85,014,550 (4,726,398) 85,589,559 3,759,532 89,349,091
Cumulative eect of change in accounting policy 2 - - - 56,894 (204,892) (147,998) (23,457) (171,455)
Revised balance at January 1, 2011 119,467 778,047 4,403,893 85,071,444 (4,931,290) 85,441,561 3,736,075 89,177,636
Prot for the year - - - 13,382,645 - 13,382,645 376,398 13,759,043
Available-for-sale nancial assets, net of tax, 9, 23 - - - - (567,186) (567,186) (4,842) (572,028)
Share of associates and joint ventures, net of tax 12 - - - - (113,898) (113,898) -(113,898)
Foreign currency translation, net of tax - - - - 123,434 123,434 60,221 183,655
Remeasurement eect of employee benet,
net of tax 17 - - - - (385,879) (385,879) 665 (385,214)
Total comprehensive income - - - 13,382,645 (943,529) 12,439,116 432,442 12,871,558
Dividends 22 - - - (824,478) - (824,478) (156,388) (980,866)
Capital transaction under common control - - - - (108,840) (108,840) 78,155 (30,685)
Eect of business combination - - - - - - 131,564 131,564
Disposal of treasury stock 23 - - - - 288,773 288,773 -288,773
Stock option activities 24 - - - - (73,008) (73,008) -(73,008)
Others - - - (6,739) (66,002) (72,741) 1,399 (71,342)
Total transactions with owners - - - (831,217) 40,923 (790,294) 54,730 (735,564)
Balance at December 31, 2011 119,467 778,047 4,403,893 97,622,872 (5,833,896) 97,090,383 4,223,247 101,313,630
The accompanying notes are an integral part of these consolidated financial statements.
(In thousands of U.S dollars (Note 2.28))
2011 USD Notes Preferred
stock
Common
stock
Share
premium
Retained
earnings
Other
reserves
Equity
attributable
to owners of
the parent
Non-
controlling
interests
Total
Balance at January 1, 2011 111,537 726,400 4,111,561 79,371,254 (4,412,658) 79,908,094 3,509,972 83,418,066
Cumulative eect of change in accounting policy 2 - - - 53,117 (191,291) (138,174) (21,900) (160,074)
Revised balance at January 1, 2011 111,537 726,400 4,111,561 79,424,371 (4,603,949) 79,769,920 3,488,072 83,257,992
Prot for the year - - - 12,494,300 - 12,494,300 351,413 12,845,713
Available-for-sale nancial assets, net of tax, 9, 23 - - - - (529,536) (529,536) (4,521) (534,057)
Share of associates and joint ventures, net of tax 12 - - - - (106,337) (106,337) - (106,337)
Foreign currency translation, net of tax - - - - 115,240 115,240 56,224 171,464
Remeasurement eect of employee benet,
net of tax 17 - - - - (360,264) (360,264) 621 (359,643)
Total comprehensive income - - - 12,494,300 (880,897) 11,613,403 403,737 12,017,140
Dividends 22 - - - (769,749) - (769,749) (146,007) (915,756)
Capital transaction under common control - - - - (101,615) (101,615) 72,967 (28,648)
Eect of business combination - - - - - - 122,831 122,831
Disposal of treasury stock 23 - - - - 269,604 269,604 - 269,604
Stock option activities 24 - - - - (68,162) (68,162) - (68,162)
Others - - - (6,292) (61,620) (67,912) 1,306 (66,606)
Total transactions with owners - - - (776,041) 38,207 (737,834) 51,097 (686,737)
Balance at December 31, 2011 111,537 726,400 4,111,561 91,142,630 (5,446,639) 90,645,489 3,942,906 94,588,395
The accompanying notes are an integral part of these consolidated financial statements.