Samsung 2012 Annual Report Download - page 53
Download and view the complete annual report
Please find page 53 of the 2012 Samsung annual report below. You can navigate through the pages in the report by either clicking on the pages listed below, or by using the keyword search tool below to find specific information within the annual report.-
 1
1 -
2
-
3
-
4
-
5
-
6
-
7
-
8
-
9
-
10
-
11
-
12
-
13
-
14
-
15
-
16
-
17
-
18
-
19
-
20
-
21
-
22
-
23
-
24
-
25
-
26
-
27
-
28
-
29
-
30
-
31
-
32
-
33
-
34
-
35
-
36
-
37
-
38
-
39
-
40
-
41
-
42
-
 43
43 -
 44
44 -
 45
45 -
 46
46 -
 47
47 -
 48
48 -
 49
49 -
 50
50 -
 51
51 -
 52
52 -
 53
53 -
 54
54 -
 55
55 -
 56
56 -
 57
57 -
 58
58 -
 59
59 -
 60
60
 |
 |

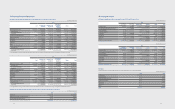
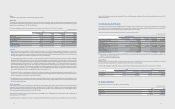
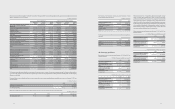
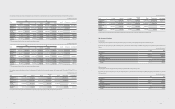
A summary of foreign assets and liabilities of the Company, presented in Korean won, as of December 31, 2012 and 2011 is as follows:
(In millions of Korean won)
2012 2011
USD EUR JPY Other USD EUR JPY Other
Financial Assets ₩12,709,235 ₩1,085,390 ₩178,373 ₩1,577,076 ₩12,310,076 ₩660,482 ₩568,204 ₩1,288,309
Financial Liabilities 9,550,081 978,953 1,142,081 214,639 11,092,528 524,075 1,064,553 197,362
Foreign currency exposure to nancial assets and liabilities of a 5% currency rate change against the Korean won are presented below.
(In millions of Korean won)
2012 2011
Increase Decrease Increase Decrease
Financial assets ₩777,504 ₩(777,504) ₩741,354 ₩(741,354)
Financial liabilities (594,288) 594,288 (643,926) 643,926
Net eect 183,216 (183,216) 97,428 (97,428)
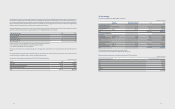
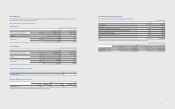
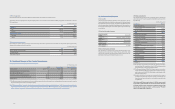
(2) Price risk
The Company’s investment portfolio consists of direct and indirect investments in equity securities classified as available-for-sale. The market values for the
Company’s equity investments for the year-ended December 31, 2012 and 2011 are ₩5,103,181 million and ₩3,149,926 million, respectively. Refer to Note 9.
If there is a change in the price of equity investments by 1%, the amount of other comprehensive income changes for the year-ended December 31, 2012 and 2011
would be ₩44,359 million and ₩25,262 million, respectively.
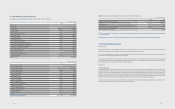
(3) Interest rate risk
Interest rate risk is dened as the risk that the fair value of future cash ows of a nancial instrument will uctuate because of changes in market interest rates.
The Company is exposed to interest rate risk mainly arising through interest bearing liabilities and assets. The Company’s position with regard to interest rate
risk exposure is mainly driven by its debt obligations such as bonds, interest-bearing deposits and issuance of receivables. In order to avoid interest rate risk, the
Company maintains minimum external borrowing by facilitating cash pooling systems on a regional and global basis. The Company manages exposed interest rate
risk via periodic monitoring and handles risk factors on a timely basis.
As of the reporting date, the interest rate prole of the Company’s interest bearing assets and liabilities is presented in the table below:
(In millions of Korean won)
2012 2011
Fixed rate Floating rate Fixed rate Floating rate
Financial assets ₩59,351,335 ₩7,816,434 ₩50,476,935 ₩2,838,767
Financial liabilities 40,632,972 2,186,448 41,129,584 880,702
103102
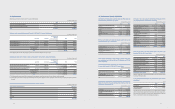
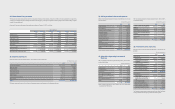
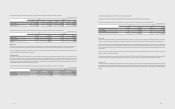
The sensitivity risk of the Company is determined based on the following assumptions:
- Changes in market interest rates that could impact the interest income and expenses of oating interest rate nancial instruments
Based on the above assumption, changes to prot and net equity as a result of 1% increases in interest rate onborrowings are presented below:
(In millions of Korean won)
2011 2012
Increase Decrease Increase Decrease
Financial assets ₩78,164 ₩(78,164) ₩28,388 ₩(28,388)
Financial liabilities (21,864) 21,864 (8,807) 8,807
₩56,300 ₩(56,300) ₩19,581 ₩(19,581)
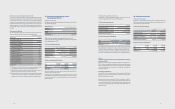
(B) Credit risk
Credit risk arises during the normal course of transactions and investing activities, where clients or another party fails to discharge an obligation. The Company
monitors and sets the counterparty’s credit limit on a periodic basis based on the counterparty’s nancial conditions, default history and other important factors.
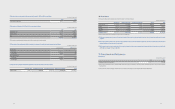
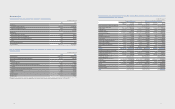
Credit risk arises from cash and cash equivalents, savings and derivative instruments transactions with nancial institutions. To minimize such risk, the Company
transacts only with banks which have strong international credit rating (S&P A above), and all new transactions with nancial institutions with no prior transaction
history are approved, managed and monitored by the Company’s nance team and the local nancial center. The Company requires separate approval for contracts
with restrictions.
Therefore, the Company estimates credit risk exposure to itself as limited and the carrying value of nancial assets represents net of impairment loss to reect the
Company’s maximum exposure to the credit risk.
The top ve customers account for approximately 12.9% and 12.9% and ₩3,074,791 million and ₩2,831,801 million of accounts receivables for the year ended 2012
and 2011, respectively, while the top three credit exposures by country amounted to 18.2%, 13.8% and 9.4% (December 31, 2011:16.0%, 14.7% and 10.4%).
(C) Liquidity risk
The Company manages its liquidity risk to maintain adequate net working capital by constantly managing projected cash ows. Beyond eective working capital and
cash management, the Company mitigates liquidity risk by contracting with nancial institutions with respect to bank overdrafts, Cash Pooling or Banking Facility
agreements for ecient management of funds. The Cash Pooling programs allow sharing of funds among subsidiaries to minimize liquidity risk and reduce nancial
expense.