Samsung 2012 Annual Report Download - page 52
Download and view the complete annual report
Please find page 52 of the 2012 Samsung annual report below. You can navigate through the pages in the report by either clicking on the pages listed below, or by using the keyword search tool below to find specific information within the annual report.-
 1
1 -
2
-
3
-
4
-
5
-
6
-
7
-
8
-
9
-
10
-
11
-
12
-
13
-
14
-
15
-
16
-
17
-
18
-
19
-
20
-
21
-
22
-
23
-
24
-
25
-
26
-
27
-
28
-
29
-
30
-
31
-
32
-
33
-
34
-
35
-
36
-
37
-
38
-
39
-
40
-
41
-
 42
42 -
 43
43 -
 44
44 -
 45
45 -
 46
46 -
 47
47 -
 48
48 -
 49
49 -
 50
50 -
 51
51 -
 52
52 -
 53
53 -
 54
54 -
 55
55 -
 56
56 -
 57
57 -
 58
58 -
 59
59 -
 60
60
 |
 |
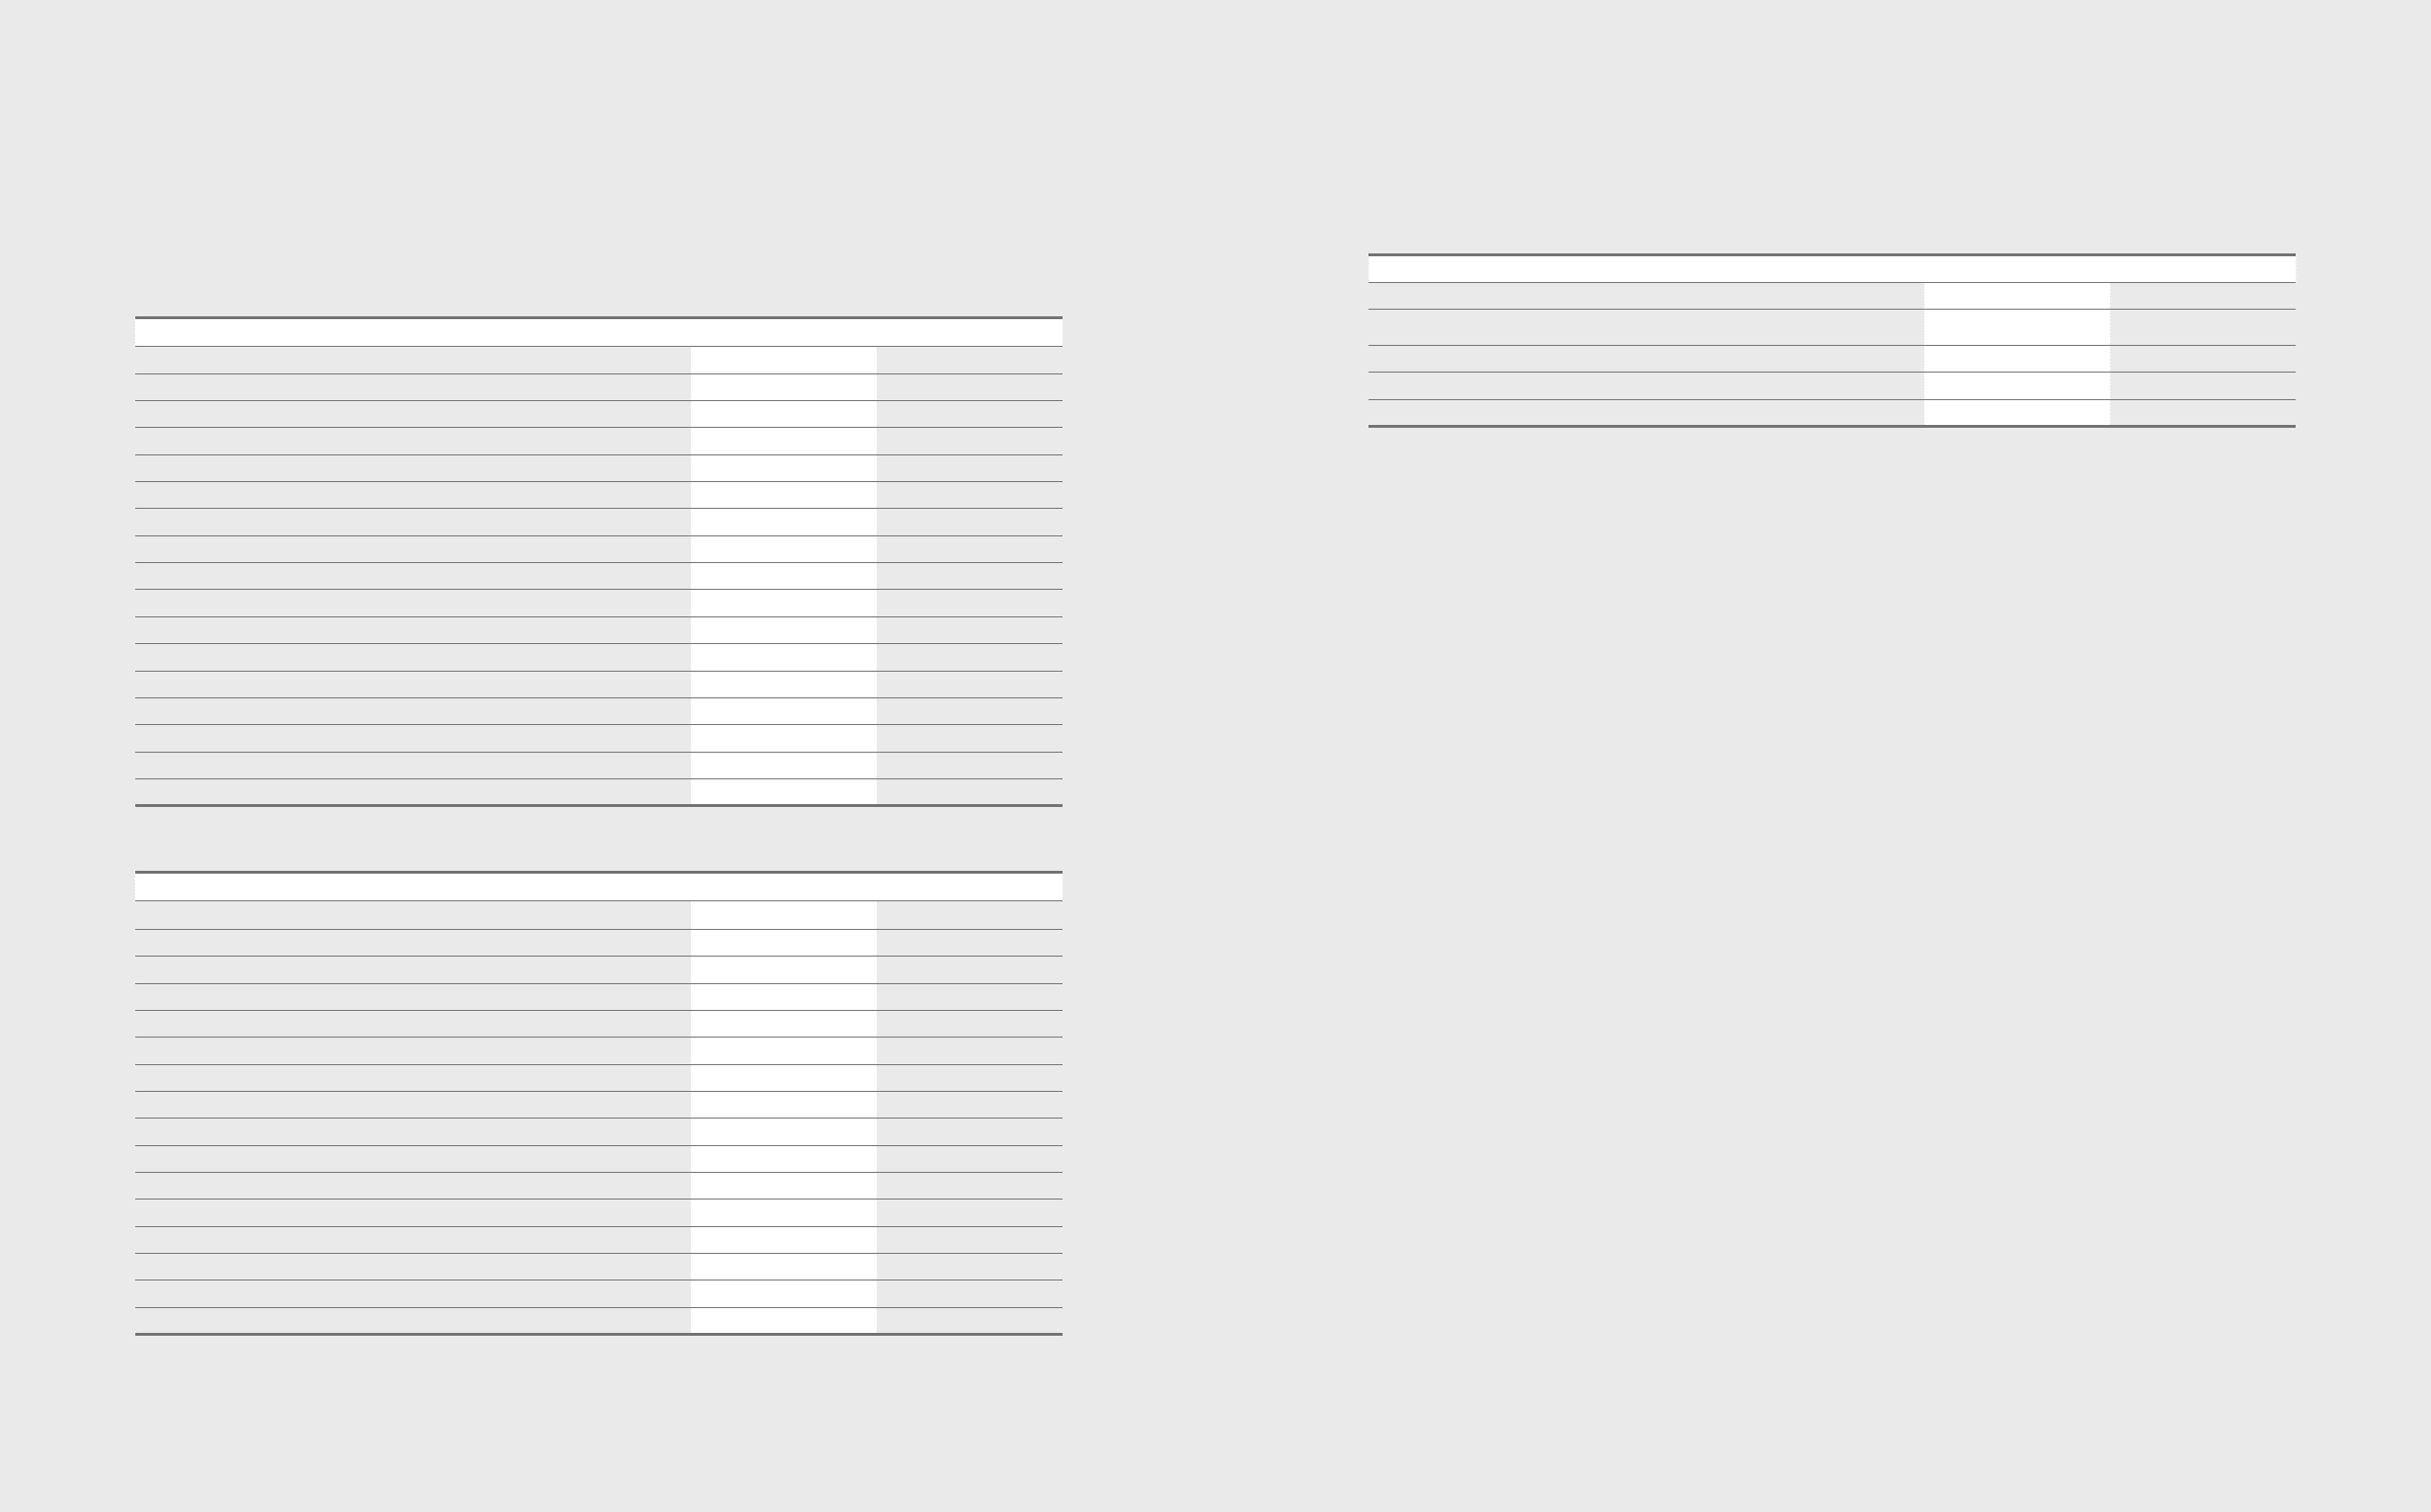
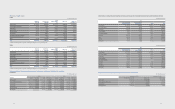
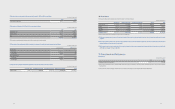
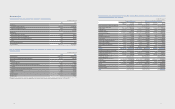
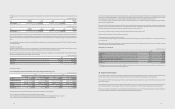
31. Cash Generated from Operations
(A) Cash flows from operating activities as of December 31, 2012 and 2011, consist of the following:
(In millions of Korean won)
2012 2011
Adjustments for:
Tax expense ₩6,069,732 ₩3,432,875
Finance income (2,068,888) (1,821,379)
Finance expense 1,755,715 1,661,180
Severance and retirement benets 768,423 584,096
Depreciation expenses 14,835,046 12,934,274
Amortization expenses 786,970 657,790
Bad debt expenses and etc. 205,424 93,801
Gain on valuation of equity method (986,611) (1,399,194)
Gain on disposal of property, plant and equipment (147,645) (113,690)
Loss on disposal of property, plant and equipment 324,993 109,338
Obsolescence and scrappage of inventories 1,212,222 1,353,320
Gain on disposal of investments (113,886) (223,535)
Gain on transfer of business - (1,062,793)
Impairment losses on intangible assets 216,790 186,759
Other income/expense (98,726) 57,787
Adjustments, total ₩22,759,559 ₩16,450,629
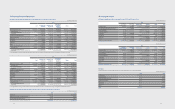
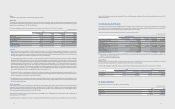
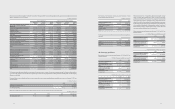
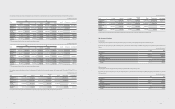
(In millions of Korean won)
2012 2011
Changes in assets and liabilities:
Increase in trade receivables ₩(2,032,126) ₩(2,015,177)
Increase in other receivables (536,202) (181,613)
Increase in advance payment (277,329) (147,387)
Increase in prepaid expenses (72,285) (27,432)
Increase in inventories (4,011,553) (3,919,683)
Increase in trade payables (465,450) 750,048
Increase in other payables (416,870) 375,478
Increase in advance received 88,152 548,416
(Decrease)/Increase in withholdings (663,733) 556,563
Increase in accrued expenses 2,183,846 508,657
Increase in utilization of provisions 1,824,693 722,421
Payment of severance benets (301,444) (256,261)
Increase in plan assets (440,420) (531,743)
Others (657,228) (439,632)
Changes in net working capital, total ₩(5,777,949) ₩(4,057,345)
101100
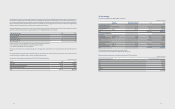
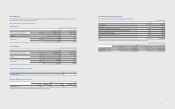
(B) Significant transactions not affecting cash flows for the years ended, 2012 and 2011, are as follows:
(In millions of Korean won)
2012 2011
Valuation of available-for-sale nancial assets ₩ 1,185,256 ₩(559,831)
Reclassication of construction-in-progress and machinery-in-transit to property,
plant and equipment 19,567,010 22,530,787
Increase in share of associates and joint ventures accumulated other comprehensive income (350,491) (113,898)
Net assets acquired from business combination (633,708) -
Net assets acquired in transfer of business - 788,454
(C) The Company reported on a net basis cash receipts and payments arising from transactions occurring frequently and short-term financial instruments,
loans, and borrowings.
(D) Among the net cash used in investing activities, cash outflows from business combination include the acquisition of assets and liabilities of CSR.
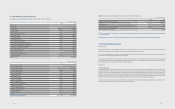
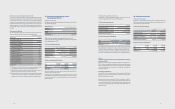
32. Financial Risk Management
Financial risk factors
The Company is exposed to credit risk, liquidity risk and market risk. Market risk arises from currency risk, interest rate risk and fair value risk associated with
investments. The Company has a risk management program in place to monitor and actively manage such risks.
Also, nancial risk management ocers are dispatched to the regional head quarters of each area including US, UK, Singapore, China, Japan, Brazil and Russia to run
and operate a local nancial center for global nancial risk management.
The Company’s nancial assets that are under nancial risk management are composed of cash and cash equivalents, short-term nancial instruments, available-
for-sale nancial assets, trade and other receivables and other nancial assets. The Company’s nancial liabilities under nancial risk management are composed of
trade and other payables, borrowings and debentures, and other nancial liabilities.
(A) Market risk
(1) Foreign exchange risk
The Company is exposed to foreign exchange risk arising from various currency exposures, primarily with respect to the United States of America, European Union,
Japan, other Asian countries and South America. Revenues and expenses arise from foreign currency transactions and exchange positions, and the most widely
used currencies are the US Dollar, EU’s EURO, Japanese Yen and Chinese Yuan. Foreign exchange risk management of the Company is carried out by both SEC and its
subsidiaries. To minimize foreign exchange risk arising from operating activities, the Company’s foreign exchange management policy requires all normal business
transactions to be in local currency, or cash-in currency be matched up with cash-out currency. The Company’s foreign risk management policy also denes foreign
exchange risk, measuring period, controlling responsibilities, management procedures, hedging period and hedge ratio very specically.
The Company limits all speculative foreign exchange transactions and operates a system to manage receivables and payables denominated in foreign currency. It
evaluates, manages and reports foreign currency exposures to receivables and payables.