Samsung 2012 Annual Report Download - page 43
Download and view the complete annual report
Please find page 43 of the 2012 Samsung annual report below. You can navigate through the pages in the report by either clicking on the pages listed below, or by using the keyword search tool below to find specific information within the annual report.-
 1
1 -
2
-
3
-
4
-
5
-
6
-
7
-
8
-
9
-
10
-
11
-
12
-
13
-
14
-
15
-
16
-
17
-
18
-
19
-
20
-
21
-
22
-
23
-
24
-
25
-
26
-
27
-
28
-
29
-
30
-
31
-
32
-
 33
33 -
 34
34 -
 35
35 -
 36
36 -
 37
37 -
 38
38 -
 39
39 -
 40
40 -
 41
41 -
 42
42 -
 43
43 -
 44
44 -
 45
45 -
 46
46 -
 47
47 -
 48
48 -
 49
49 -
 50
50 -
 51
51 -
 52
52 -
 53
53 -
54
-
55
-
56
-
57
-
58
-
59
-
60
 |
 |
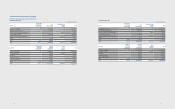
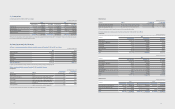
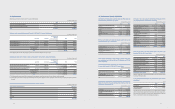
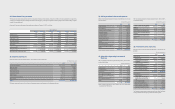
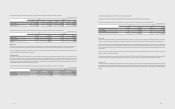
13. Property, Plant and Equipment
(A) Changes in property, plant and equipment for the years ended December 31, 2012 and 2011, are as follows:
(In millions of Korean won)
2012
Land Buildings and
Structures
Machinery and
Equipment
Construction
-In-Progress/
Machinery-
In-Transit
Others Total
Balance at January 1, 2012 ₩7,214,734 ₩12,778,760 ₩33,453,220 ₩6,982,473 ₩1,614,764 ₩62,043,951
Acquisition cost 7,214,734 18,472,852 96,618,176 6,982,473 4,683,845 133,972,080
Accumulated depreciation
impairment - (5,694,092) (63,164,956) - (3,069,081) (71,928,129)
Acquisition and capital expense (*) 54,960 1,681,106 18,302,895 1,854,111 956,723 22,849,795
Business combinations - - 654,490 21,612 29,007 705,109
Depreciation - (1,121,614) (12,895,133) - (818,299) (14,835,046)
Sale/Disposal (76,724) (100,854) (604,989) (22,213) (114,292) (919,072)
Impairment - (3,992) (211,299) - (34) (215,325)
Others (40,829) (224,567) (653,008) (343,098) 116,833 (1,144,669)
Balance at December 31, 2012 ₩7,152,141 ₩13,008,839 ₩38,046,176 ₩8,492,885 ₩1,784,702 ₩68,484,743
Acquisition cost 7,152,141 19,624,030 110,034,355 8,492,885 5,011,914 150,315,325
Accumulated depreciation and
impairment - (6,615,191) (71,988,179) - (3,227,212) (81,830,582)
(*) The capitalized borrowing costs are ₩36,129 million and the interest rate used to calculate the borrowing costs eligible for capitalization is 2.50%.
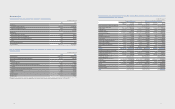
(In millions of Korean won)
2011
Land Buildings and
Structures
Machinery and
Equipment
Construction
-In-Progress/
Machinery-
In-Transit
Others Total
Balance at January 1, 2011 ₩6,631,392 ₩10,312,316 ₩26,474,573 ₩8,243,827 ₩1,302,486 ₩52,964,594
Acquisition cost 6,631,392 15,055,715 81,456,534 8,243,827 4,147,859 115,535,327
Accumulated depreciation
impairment - (4,743,399) (54,981,961) - (2,845,373) (62,570,733)
Acquisition and capital expense (*) 553,058 3,443,087 18,596,927 (966,244) 1,046,373 22,673,201
Business combinations 53,771 55,605 5,522 451 8,620 123,969
Depreciation - (980,863) (11,244,032) - (709,379) (12,934,274)
Sale/Disposal (22,394) (49,794) (376,727) - (83,507) (532,422)
Impairment - (4,923) (81,641) - (55) (86,619)
Others (1,093) 3,332 78,598 (295,561) 50,226 (164,498)
Balance at December 31, 2011 ₩7,214,734 ₩12,778,760 ₩33,453,220 ₩6,982,473 ₩1,614,764 ₩62,043,951
Acquisition cost 7,214,734 18,472,852 96,618,176 6,982,473 4,683,845 133,972,080
Accumulated depreciation and
impairment - (5,694,092) (63,164,956) - (3,069,081) (71,928,129)
(*) The capitalized borrowing costs are ₩46,863 million and the interest rate used to calculate the borrowing costs eligible for capitalization is 4.35%.
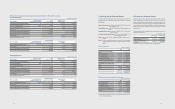
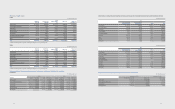
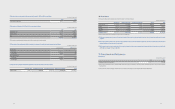
(B) Details of property, plant and equipment’s depreciation by line item as of December 31, 2012 and 2011, are as follows:
(In millions of Korean won)
2012 2011
Cost of sales ₩13,666,700 ₩11,945,495
Selling, general and administrative expenses 442,080 368,123
Research and development expenses 726,266 620,656
₩14,835,046 ₩12,934,274
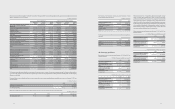
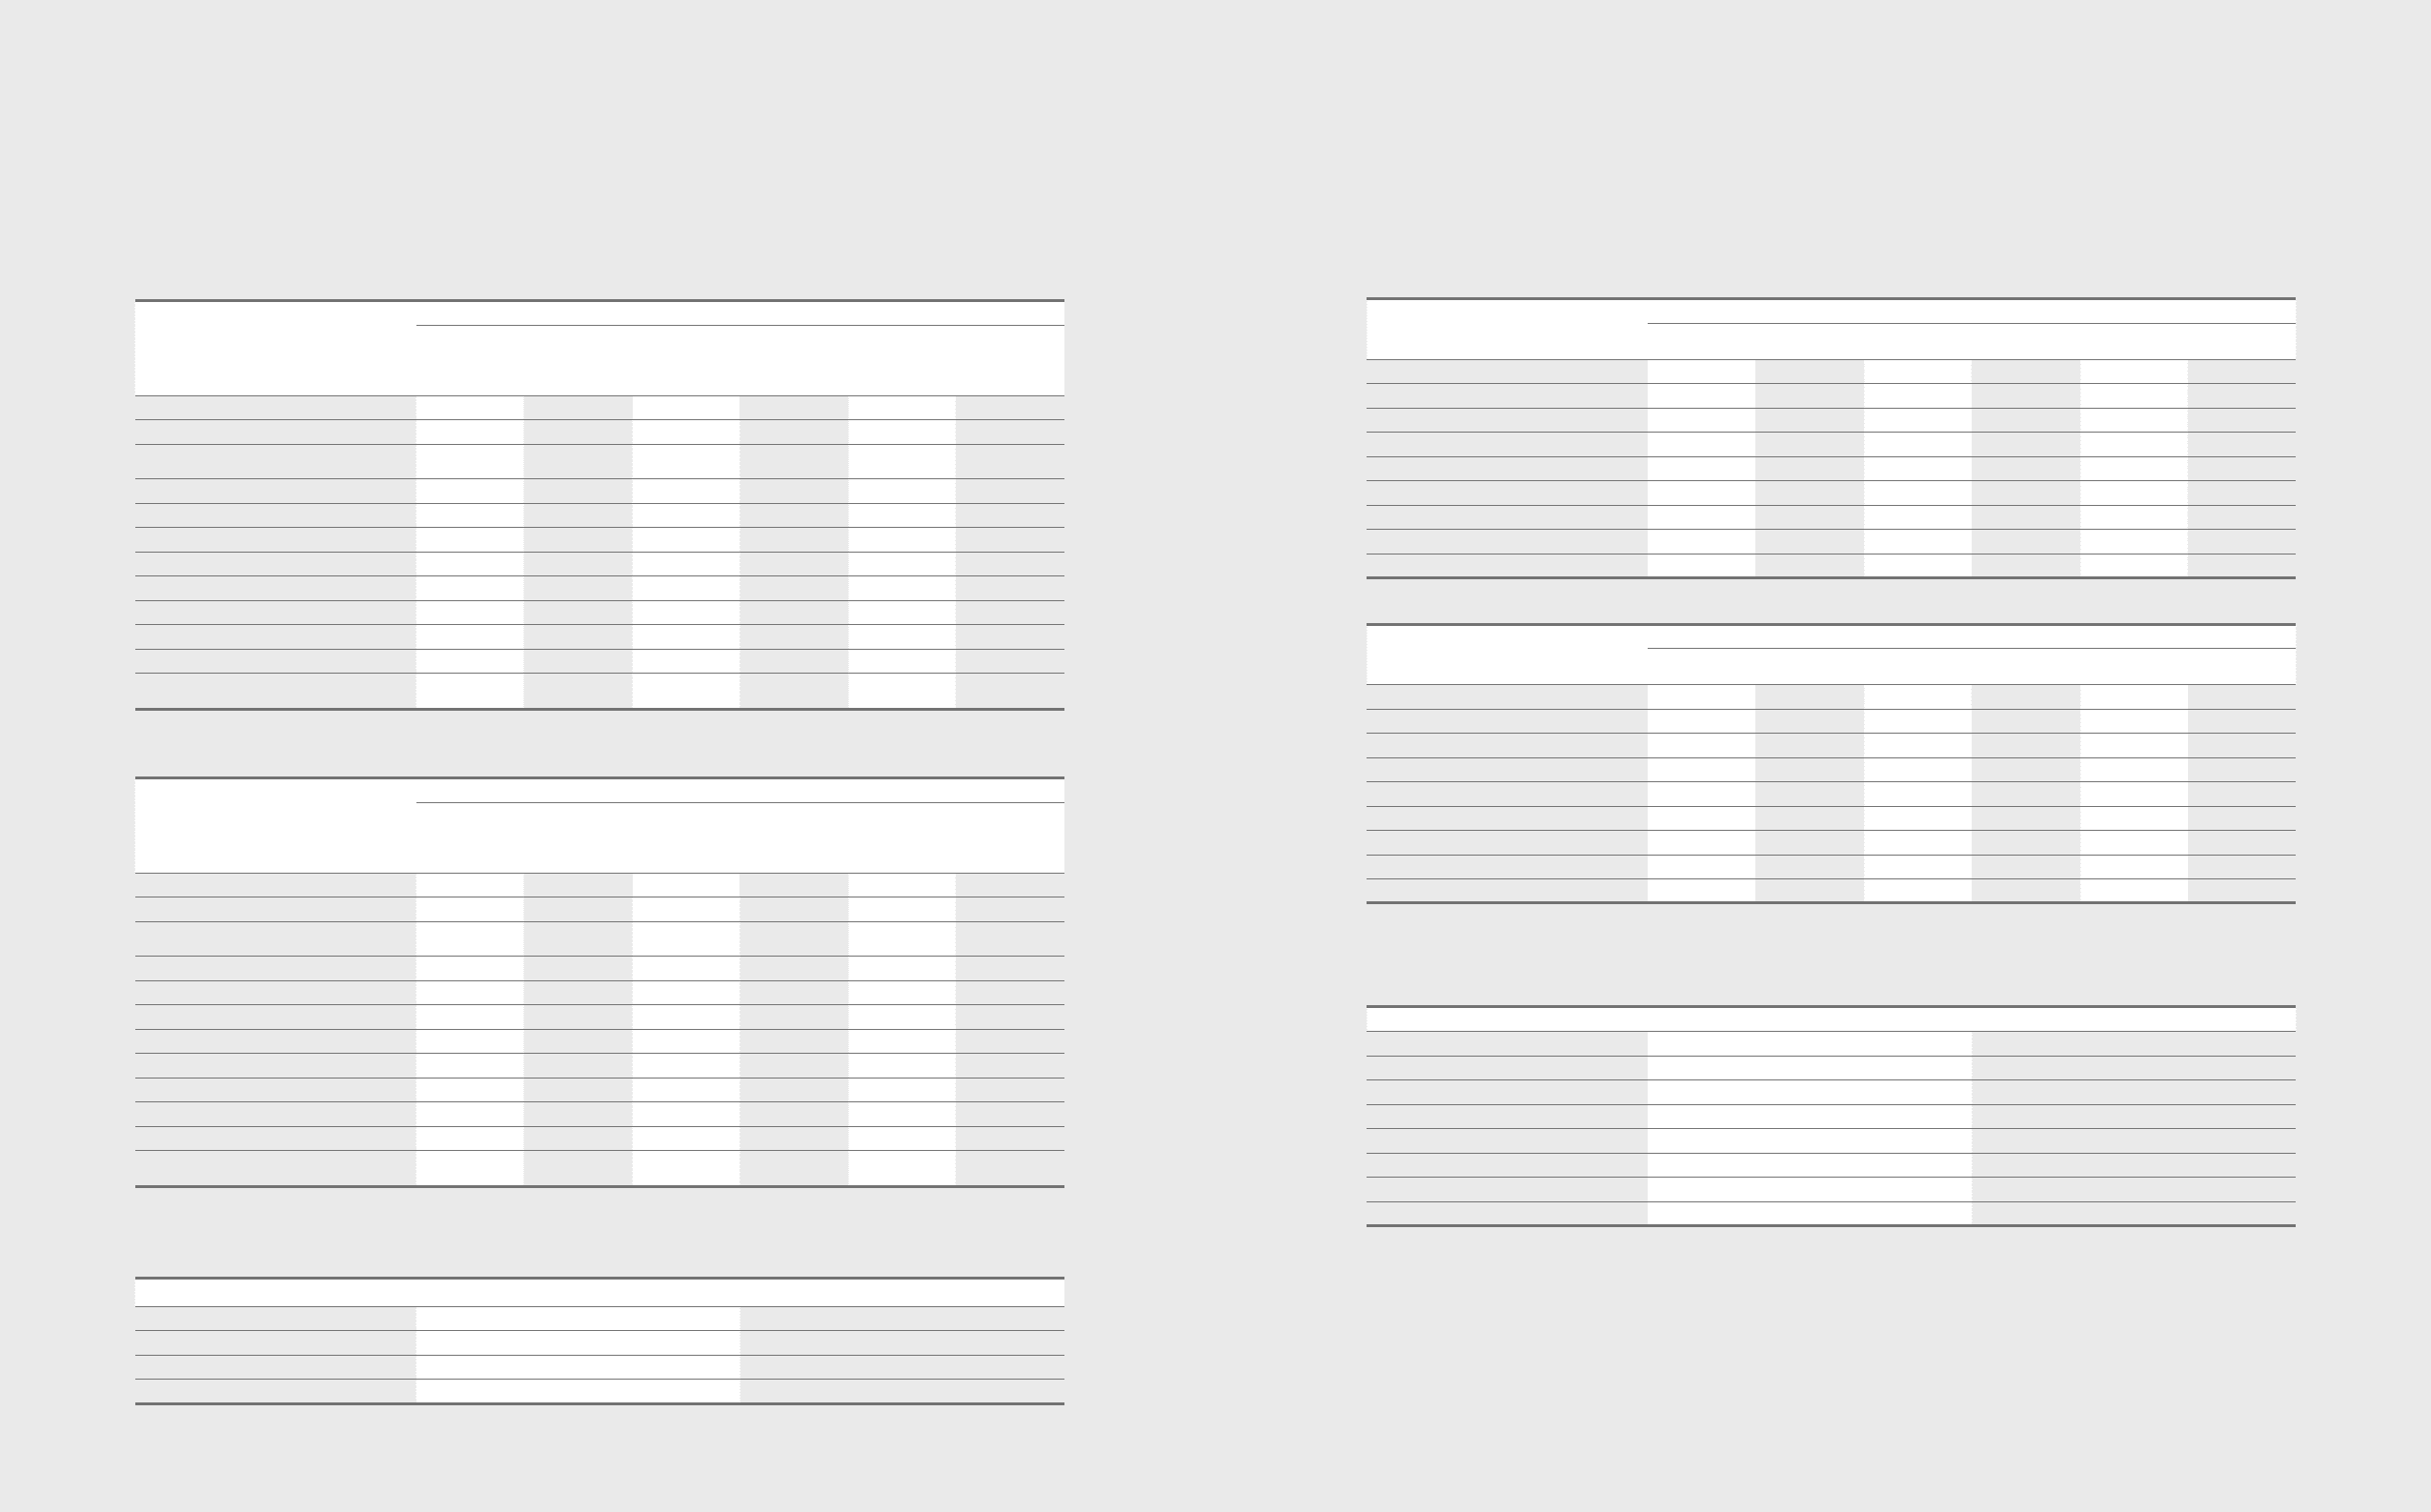
14. Intangible Assets
(A) Changes in intangible assets for the years ended December 31, 2012 and 2011, are as follows:
(In millions of Korean won)
2012
Intellectual
property rights
Capitalized
cost Membership Goodwill Others Total
At January 1, 2012 ₩983,802 ₩473,024 ₩197,957 ₩523,409 ₩1,177,044 ₩3,355,236
Internally generated (development costs) - 359,639 - - - 359,639
External acquisition 227,538 - 9,520 - 64,832 301,890
Business Combinations 163,164 - 3,670 259,961 71,917 498,712
Amortization (169,668) (229,186) - - (388,116) (786,970)
Sale/Disposal (13,123) - (39,095) - (980) (53,198)
Impairment (124) (1,203) - (204,746) (10,717) (216,790)
Others (5,556) -(1,209) (4,779) 282,730 271,186
Balance at December 31, 2012 ₩1,186,033 ₩602,274 ₩170,843 ₩573,845 ₩1,196,710 ₩3,729,705
(In millions of Korean won)
2011
Intellectual
property rights
Capitalized
cost Membership Goodwill Others Total
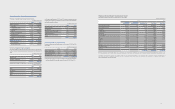
At January 1, 2011 ₩601,882 ₩334,617 ₩191,431 ₩571,412 ₩1,080,097 ₩2,779,439
Internally generated (development costs) - 331,576 - - - 331,576
External acquisition 260,399 - 3,494 - 68,209 332,102
Business Combinations 234,644 - - 135,118 181,455 551,217
Amortization (125,636) (193,169) - - (338,985) (657,790)
Sale/Disposal (18,927) - (93) - (5,109) (24,129)
Impairment (85) - - (183,145) (236) (183,466)
Others 31,525 -3,125 24 191,613 226,287
Balance at December 31, 2011 ₩983,802 ₩473,024 ₩197,957 ₩523,409 ₩1,177,044 ₩3,355,236
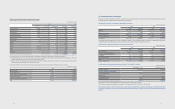
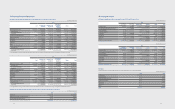
(B) Goodwill
Goodwill is allocated to Cash-Generating Units at the end of the reporting period, and consists of the following:
(In millions of Korean won)
2012 2011
S. LSI business ₩112,723 ₩-
Memory business 74,995 39,883
Health care equipment business 89,258 80,799
Digital Imaging business 82,599 287,199
LCD business 80,299 80,299
LED business 79,277 -
Others 54,694 35,229
Total ₩573,845 ₩523,409
8382