Samsung 2012 Annual Report Download - page 27
Download and view the complete annual report
Please find page 27 of the 2012 Samsung annual report below. You can navigate through the pages in the report by either clicking on the pages listed below, or by using the keyword search tool below to find specific information within the annual report.-
 1
1 -
2
-
3
-
4
-
5
-
6
-
7
-
8
-
9
-
10
-
11
-
12
-
13
-
14
-
15
-
16
-
 17
17 -
 18
18 -
 19
19 -
 20
20 -
 21
21 -
 22
22 -
 23
23 -
 24
24 -
 25
25 -
 26
26 -
 27
27 -
 28
28 -
 29
29 -
 30
30 -
 31
31 -
 32
32 -
 33
33 -
 34
34 -
 35
35 -
 36
36 -
 37
37 -
38
-
39
-
40
-
41
-
42
-
43
-
44
-
45
-
46
-
47
-
48
-
49
-
50
-
51
-
52
-
53
-
54
-
55
-
56
-
57
-
58
-
59
-
60
 |
 |

5150
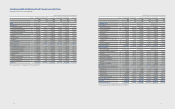
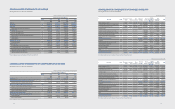
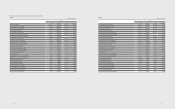
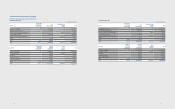
CONSOLIDATE STATEMENTS OF CASH FLOWS
Samsung Electronics Co., Ltd. and its subsidiaries
(In millions of Korean won, in thousands of U.S dollars (Note 2.28))
For the year ended December 31,
Notes 2012 2011 2012 2011
KRW KRW USD USD
Cash ows from operating activities
Prot for the year 23,845,285 13,759,043 22,262,426 12,845,713
Adjustments 31 22,759,559 16,450,629 21,248,771 15,358,630
Changes in operating assets and liabilities 31 (5,777,949) 4,057,345) (5,394,406) (3,788,017)
Cash ows from operating activities 40,826,895 26,152,327 38,116,791 24,416,326
Interest received 789,397 755,859 736,997 705,685
Interest paid (576,379) (641,462) (538,119) (598,882)
Dividend received 1,112,940 628,585 1,039,063 586,859
Income tax paid (4,180,044) 3,977,408) (3,902,572) (3,713,385)
Net cash generated from operating activities 37,972,809 22,917,901 35,452,160 21,396,603
Cash ows from investing activities
Net decrease (increase) in short-term nancial instruments (5,965,611) 75,666 (5,569,612) 70,643
Net decrease (increase) in short-term available-for-sale nancial assets (589,072) 518,479 (549,969) 484,062
Proceeds from disposal of long-term available-for-sale nancial assets 106,208 415,096 99,158 387,542
Acquisition of long-term available-for-sale nancial assets (870,249) (419,678) (812,482) (391,820)
Proceeds from disposal of associates and joint ventures 41,091 306,804 38,363 286,438
Acquisition of associates and joint ventures (279,022) (403,538) (260,500) (376,751)
Disposal of property and equipment 644,062 379,878 601,309 354,662
Purchases of property and equipment (22,965,271) (21,965,678) (21,440,828) (20,507,588)
Disposal of intangible assets 61,497 9,703 57,415 9,059
Purchases of intangible assets (650,884) (663,678) (607,678) (619,623)
Proceeds from deposits 313,043 461,454 292,263 430,823
Payment for deposits (347,746) (594,067) (324,662) (554,633)
Cash outows from business combination (464,279) (522,740) (433,460) (488,040)
Cash inows from disposal of business - 925,454 -864,022
Others (355,321) 364,281 (331,735) 340,10 0
Net cash used in investing activities (31,321,554) (21,112,564) (29,242,418) (19,711,104)
Cash ows from nancing activities
Net (repayment) proceeds from shortterm borrowings (800,579) 977,315 (747,436) 912,440
Disposal of treasury stock 88,473 160,827 82,600 150,151
Proceeds from long-term borrowings and debentures 1,862,256 3,925,406 1,738,639 3,664,836
Repayment of long-term borrowings and debentures (522,899) (1,145,167) (488,189) (1,069,150)
Payment of dividends (1,265,137) (874,608) (1,181,157) (816,551)
Net increase (decrease) in Non-controlling interests (1,200,134) 363,417 (1,120,469) 339,293
Others (26,488) (297,461) (24,729) (277,715)
Net cash provided by (used in) nancing activities (1,864,508) 3,109,729 (1,740,741) 2,903,304
Eect of exchange rate changes on cash and cash equivalents (687,048) (14,724) (641,442) (13,747)
Net increase (decrease) in cash and cash equivalents 4,099,699 4,900,342 3,827,559 4,575,056
Cash and cash equivalents
Beginning of the year 14,691,761 9,791,419 13,716,517 9,141,461
End of the year 18,791,460 14,691,761 17,544,076 13,716,517
The accompanying notes are an integral part of these consolidated financial statements.
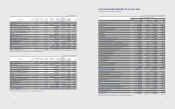
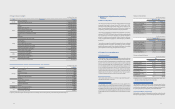
(In millions of Korean won)
2012 KRW Notes Preferred
stock
Common
stock
Share
premium
Retained
earnings
Other
reserves
Equity
attributable
to owners of
the parent
Non-
controlling
interests
Total
Balance at January 1, 2012 119,467 778,047 4,403,893 97,622,872 (5,833,896) 97,090,383 4,223,247 101,313,630
Prot for the year - - - 23,185,375 - 23,185,375 659,910 23,845,285
Available-for-sale nancial assets, net of tax 9, 23 - - - - 960,688 960,688 1,496 962,184
Share of associates and joint ventures, net of tax 12 - - - - (350,491) (350,491) - (350,491)
Foreign currency translation, net of tax - - - - (1,789,877) (1,789,877) (34,776) (1,824,653)
Remeasurement eect of employee benet,
net of tax 17 - - - - (506,351) (506,351) 2,231 (504,120)
Total comprehensive income - - - 23,185,375 (1,686,031) 21,499,344 628,861 22,128,205
Dividends 22 - - - (827,501) - (827,501) (373,632) (1,201,133)
Capital transaction under common control - - - - (1,089,835) (1,089,835) (104,395) (1,194,230)
Eect of business combination - - - - - - 12,844 12,844
Disposal of treasury stock 23 - - - - 455,377 455,377 - 455,377
Stock option activities 24 - - - - (33,071) (33,071) - (33,071)
Others - - - 4,943 (5,588) (645) (771) (1,416)
Total transactions with owners - - - (822,558) (673,117) (1,495,675) (465,954) (1,961,629)
Balance at December 31, 2012 119,467 778,047 4,403,893 119,985,689 (8,193,044) 117,094,052 4,386,154 121,480,206
The accompanying notes are an integral part of these consolidated financial statements.
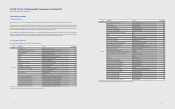
(In thousands of U.S dollars (Note 2.28))
2012 USD Notes Preferred
stock
Common
stock
Share
premium
Retained
earnings
Other
reserves
Equity
attributable
to owners of
the parent
Non-
controlling
interests
Total
Balance at January 1, 2012 111,537 726,400 4,111,561 91,142,630 (5,446,639) 90,645,489 3,942,906 94,588,395
Prot for the year - - - 21,646,322 - 21,646,322 616,104 22,262,426
Available-for-sale nancial assets, net of tax 9, 23 - - - - 896,917 896,917 1,397 898,314
Share of associates and joint ventures, net of tax 12 - - - - (327,225) (327,225) - (327,225)
Foreign currency translation, net of tax - - - - (1,671,064) (1,671,064) (32,468) (1,703,532)
Remeasurement eect of employee benet,
net of tax 17 - - - - (472,739) (472,739) 2,083 (470,656)
Total comprehensive income - - - 21,646,322 (1,574,111) 20,072,211 587,116 20,659,327
Dividends 22 - - - (772,571) - (772,571) (348,830) (1,121,401)
Capital transaction under common control - - - - (1,017,491) (1,017,491) (97,466) (1,114,957)
Eect of business combination - - - - - - 11,991 11,991
Disposal of treasury stock 23 - - - - 425,149 425,149 - 425,149
Stock option activities 24 - - - - (30,876) (30,876) - (30,876)
Others - - - 4,615 (5,217) (602) (720) (1,322)
Total transactions with owners - - - (767,956) (628,435) (1,396,391) (435,025) (1,831,416)
Balance at December 31, 2012 111,537 726,400 4,111,561 112,020,996 (7,649,185) 109,321,309 4,094,997 113,416,306
The accompanying notes are an integral part of these consolidated financial statements.