Samsung 2012 Annual Report Download - page 54
Download and view the complete annual report
Please find page 54 of the 2012 Samsung annual report below. You can navigate through the pages in the report by either clicking on the pages listed below, or by using the keyword search tool below to find specific information within the annual report.-
 1
1 -
2
-
3
-
4
-
5
-
6
-
7
-
8
-
9
-
10
-
11
-
12
-
13
-
14
-
15
-
16
-
17
-
18
-
19
-
20
-
21
-
22
-
23
-
24
-
25
-
26
-
27
-
28
-
29
-
30
-
31
-
32
-
33
-
34
-
35
-
36
-
37
-
38
-
39
-
40
-
41
-
42
-
43
-
 44
44 -
 45
45 -
 46
46 -
 47
47 -
 48
48 -
 49
49 -
 50
50 -
 51
51 -
 52
52 -
 53
53 -
 54
54 -
 55
55 -
 56
56 -
 57
57 -
 58
58 -
 59
59 -
 60
60
 |
 |
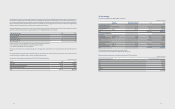
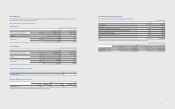
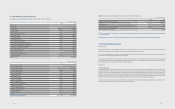
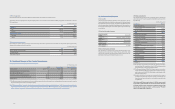
The following table is an undiscounted cash ow analysis for nancial liabilities that are presented on the balance sheet according to their remaining contractual
maturity.
(In millions of Korean won)
2012 Less than
3 months
4-6
months
7-12
months
1-5
years
More than
5 years
Financial liabilities ₩32,257,940 ₩1,690,825 ₩2,371,879 ₩7,006,975 76,236
(In millions of Korean won)
2011 Less than
3 months
4-6
months
7-12
months
1-5
years
More than
5 years
Financial liabilities ₩31,045,236 ₩1,134,966 ₩3,951,111 ₩6,467,585 ₩92,737
The Company’s trading portfolio derivative instruments have been included at their fair value of ₩79,212 million (2011: ₩40,932 million) within the less than three
month time bucket because the contractual maturities are not essential for an understanding of the timing of the cash ows. These contracts are managed on a
net-fair value basis rather than by maturity date. Net settled derivatives consist of forward exchange contracts used by the Company to manage the exchange rate
prole.
The maximum liquidity risk exposure from other than nancial liabilities (e.g. debt guarantee with rental housing) at December 31, 2012 is ₩151,817 million (December 31,
2011: ₩153,989 million).
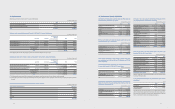
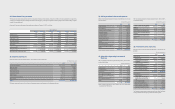
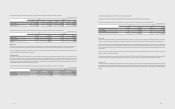
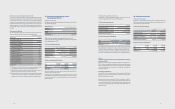
(D) Capital risk management
The object of capital management is to maintain a sound capital structure. Consistent with others in the industry, the Company monitors capital on the basis of a total
liabilities to equity ratio. This ratio is calculated as total liabilities divided by equity based on the consolidated nancial statements.
During 2012, the Company’s strategy was to maintain a reliable credit rating. The Company has maintained an A credit rating from S&P and A1 from Moody’s throughout
the period. The gearing ratios at 31 December 2012 and 2011 were as follows:
(In millions of Korean won)
2012 2011
Total liabilities ₩59,591,364 ₩54,486,633
Total equity 121,480,206 101,313,630
Gearing ratio 49.1% 53.8%
(E) Fair value estimation
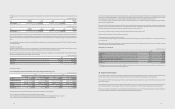
(1) The following table presents the assets and liabilities that are measured by fair value hierarchy, by level.
(In millions of Korean won)
2012 2011
Level 1 Level 2 Level 3 Total balance Level 1 Level 2 Level 3 Total balance
Derivatives ₩-₩ 47,227 ₩-₩ 47,227 ₩ - ₩ 130,057 ₩ - ₩ 130,057
Available-for-sale nancial
assets 5,694,730 125,994 389,195 6,209,919 3,182,156 73,672 623,739 3,879,567
Total assets 5,694,730 173,221 389,195 6,257,146 3,182,156 203,729 623,739 4,009,624
Derivatives - 79,212 - 79,212 - 40,932 - 40,932
Total liabilities ₩-₩ 79,212 ₩-₩ 79,212 ₩ - ₩ 40,932 ₩ - ₩ 40,932
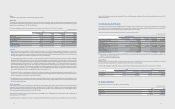
The levels of the fair value hierarchy and its application to financial assets and liabilities are described below.
·Level 1 : Quoted prices (unadjusted) in active markets for identical assets or liabilities
·Level 2 : Inputs other than quoted prices included within level 1 that are observable for the asset or liability, either directly or indirectly
·Level 3 : Inputs for the asset or liability that are not based on observable market data (that is, unobservable inputs)
105104
The fair value of nancial instruments traded in active markets is based on quoted market prices at the balance sheet date. A market is regarded as active if quoted
prices are readily and regularly available from an exchange, dealer, broker, industry group, pricing service, or regulatory agency, and those prices represent actual
and regularly occurring market transactions on an arm’s length basis. The quoted market price used for nancial assets held by the Company
is the current bid price. These instruments are included in level 1. Instruments included in level 1 comprise exclusively of listed equity investments classied as
trading securities or available-for-sale.
The fair value of financial instruments that are not traded in an active market (for example, over-the-counter derivatives) is determined by using valuation
techniques. These valuation techniques maximize the use of observable market data where it is available and rely as little as possible on entity specic estimates. If
all signicant inputs required to fair value an instrument are observable, the instrument is included in level 2.
If one or more of the signicant inputs is not based on observable market data, the instrument is included in level 3.
Specic valuation techniques used to value nancial instruments include:
· Quoted market prices or dealer quotes for similar instruments.
· The fair value of forward foreign exchange contracts is determined using forward exchange rates at the balance sheet date, with the resulting value discounted
back to present value.
Other techniques, such as discounted cash ow analysis, are used to determine fair value for the remaining nancial instruments. As for trade and other receivables,
the book value approximates a reasonable estimate of fair value.
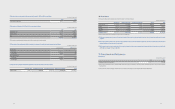
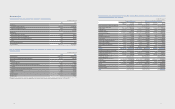
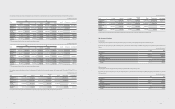
(2) Changes in Level 3 instruments:
(In millions of Korean won)
2012 2011
Opening balance ₩623,739 ₩326,359
Purchases 82,508 397,865
Disposals (31,972) (97,390)
Gains and losses recognized in other comprehensive income (6,294) 69,004
Others (*) (278,786) (72,099)
Closing balance ₩389,195 ₩623,739
(*) CSOT equity securities, which are non-marketable securities, are measured at cost as the range of reasonable fair value estimates is significant and the
probabilities of the various estimates cannot be reasonably assessed.
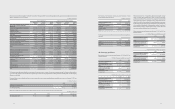
33. Segment Information
The chief operating decision maker has been identied as the Management Committee. The Management Committee is responsible for making strategic decisions
based on review of the group’s internal reporting. The Management Committee has determined the operating segments based on these reports.
The Management Committee reviews operating profits of each operating segment in order to assess performance and make decisions about resources to be
allocated to the segment.
The operating segments are product based and include CE, IM, Semiconductor and LCD. In accordance with the changes of the Accounting Policies (Note 2) to
provide consistent presentation, operating segment information of the previous year has been re-written to match with organizational changes made in 2012.
Depreciation, amortization of intangible assets, and operating prot were prepared after the allocation of internal transaction adjustments. Assets and liabilities of
each operating segment are excluded as it has not been provided regularly to the Management Committee.