Samsung 2012 Annual Report Download - page 39
Download and view the complete annual report
Please find page 39 of the 2012 Samsung annual report below. You can navigate through the pages in the report by either clicking on the pages listed below, or by using the keyword search tool below to find specific information within the annual report.-
 1
1 -
2
-
3
-
4
-
5
-
6
-
7
-
8
-
9
-
10
-
11
-
12
-
13
-
14
-
15
-
16
-
17
-
18
-
19
-
20
-
21
-
22
-
23
-
24
-
25
-
26
-
27
-
28
-
 29
29 -
 30
30 -
 31
31 -
 32
32 -
 33
33 -
 34
34 -
 35
35 -
 36
36 -
 37
37 -
 38
38 -
 39
39 -
 40
40 -
 41
41 -
 42
42 -
 43
43 -
 44
44 -
 45
45 -
 46
46 -
 47
47 -
 48
48 -
 49
49 -
50
-
51
-
52
-
53
-
54
-
55
-
56
-
57
-
58
-
59
-
60
 |
 |
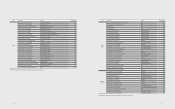
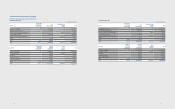
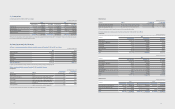
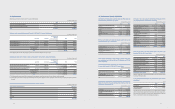
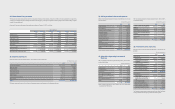
9. Available-for-Sale Financial Assets
The changes of available-for-sale nancial assets are as follows:
(In millions of Korean won)
2012 2011
Balance as of January 1 ₩3,879,567 ₩4,199,358
Acquisitions 2,630,247 2,309,143
- Increase from business
combinations 16,544 1,018
Disposals (1,171,666) (2,004,296)
Changes in value, net of tax 1,185,256 (559,831)
Impairment losses (28,009) (39)
Translation and exchange dierence (19,302) 1,007
Others 11,956 (65,775)
Balance as of December 31 ₩6,488,049 ₩3,879,567
A) Current portion 1,258,874 655,969
B) Non-current portion 5,229,175 3,223,598
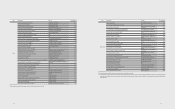
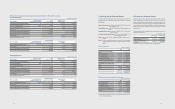
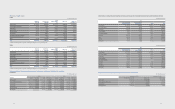
(A) Short-term available-for-sale nancial assets
Short-term available-for-sale nancial assets as of December 31, 2012 and 2011
consist of national bonds and beneciary certicates whose maturities are within
1 year.
(In millions of Korean won)
2012 2011
National bonds ₩1₩-
Beneciary certicates (*) 1,258,873 655,969
₩1,258,874 ₩655,969
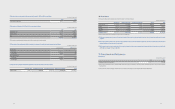
(*) Beneciary certicates as of December 31, 2012 and 2011 consist of follows:
(In millions of Korean won)
2012 2011
Bonds ₩1,159,290 ₩647,379
Time deposits 238 715
Call loan 85,200 -
Others 14,145 7,875
₩1,258,873 ₩655,969
For the years ended December 31, 2012 and 2011, changes in valuation gain (loss)
recognized in equity (other comprehensive income) on short-term available-for-
sale nancial assets are as follows:
(In millions of Korean won)
2012 2011
Balance at January 1 ₩5,969 ₩9,144
Fair value gains 8,873 5,969
Net gains transferred from equity (5,969) (9,144)
Balance at December 31 8,873 5,969
Deferred income tax and minority
interest (2,147) (1,444)
₩6,726 ₩4,525
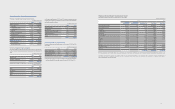
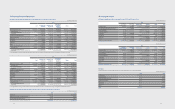
(B) Long-term available-for-sale nancial assets
Long-term available-for-sale nancial assets as of December 31, 2012 and 2011
are as follows:
(In millions of Korean won)
Detail 2012 2011
Equity securities-Listed (1) ₩4,435,856 ₩2,526,187
Equity securities-Unlisted (2) 667,325 623,739
Debt securities (*) 125,994 73,672
₩5,229,175 ₩3,223,598
(*) The maximum exposure to credit risk of debt securities that are available-for-
sale nancial assets is the carrying value as of December 31, 2012 and 2011.
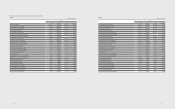
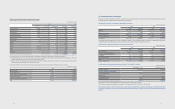
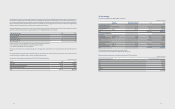
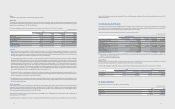
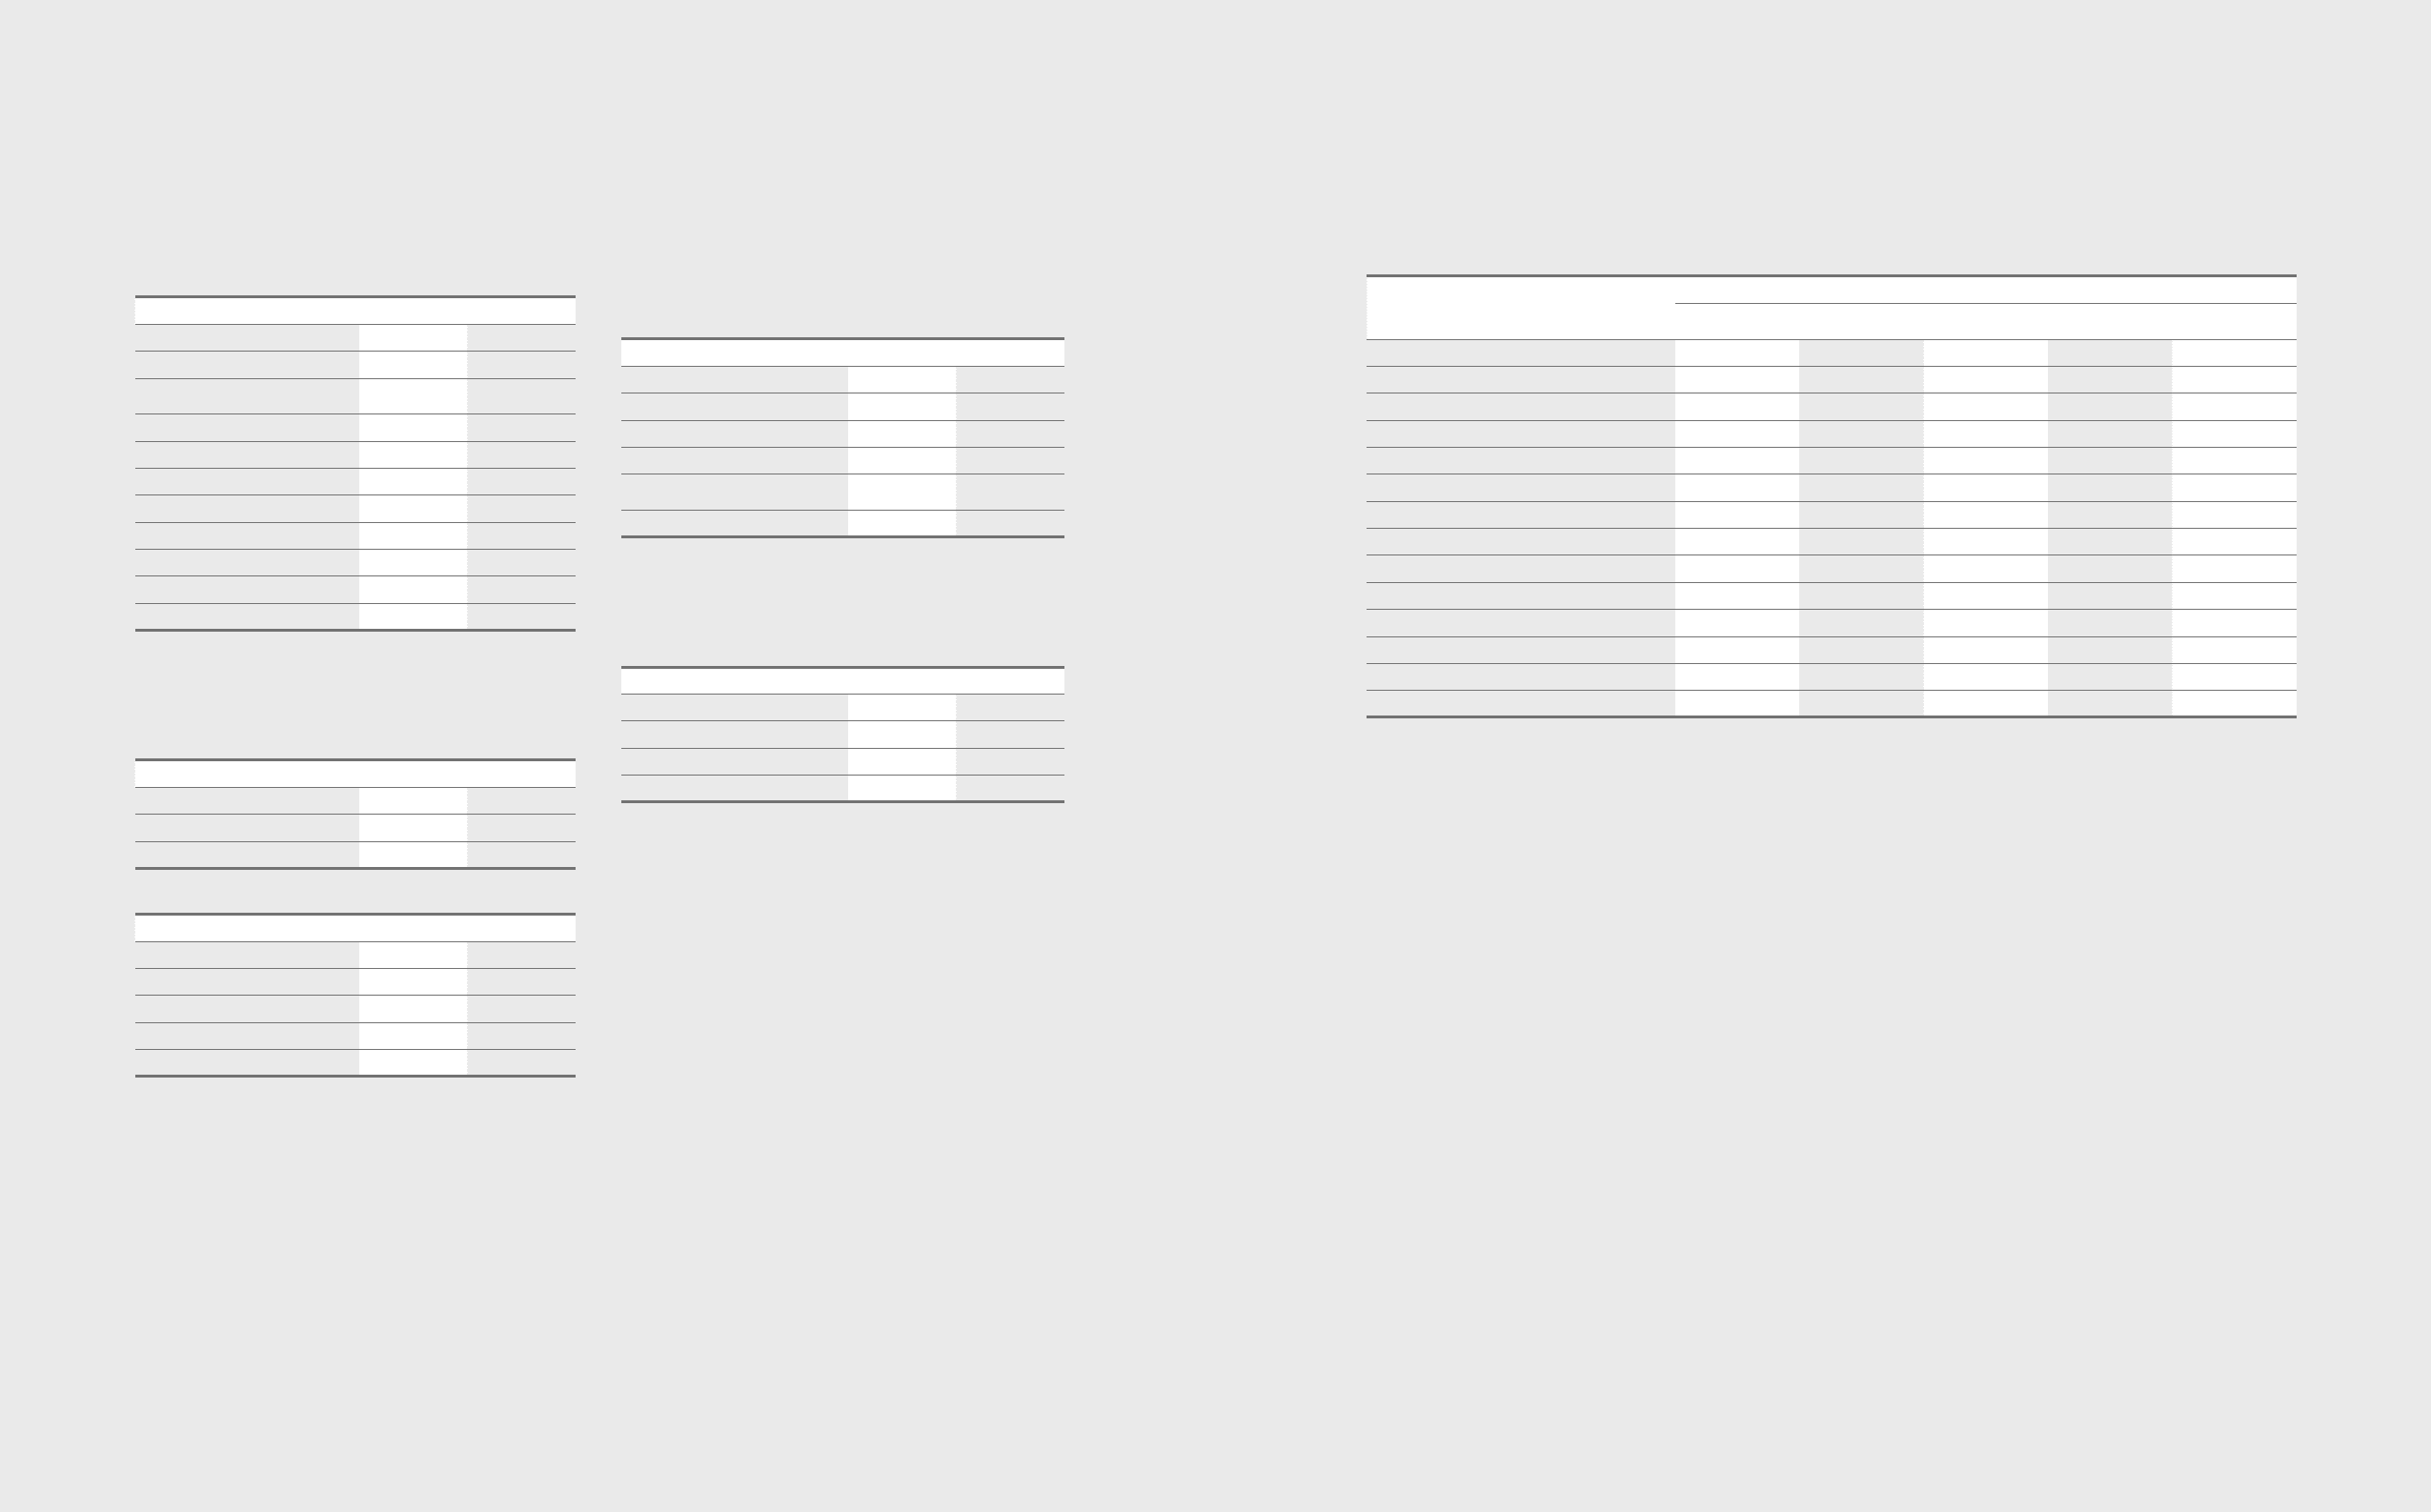
(1) Equity securities-Listed (Except for Associates and Joint Ventures)
Listed equity securities as of December 31, 2012 and 2011, are as follows:
(In millions of Korean won)
2012 2011
Number of
Shares Owned
Percentage
of Ownership(%) Acquisition Cost Book Value Book Value
Samsung Heavy Industries 40,675,641 17.6 ₩258,299 ₩1,568,046 ₩1,134,850
Samsung Fine Chemicals 2,164,970 8.4 45,678 132,063 132,063
Hotel Shilla 2,004,717 5.0 13,957 88,107 77,182
Cheil Worldwide 2,998,725 2.6 2,920 64,623 56,826
iMarket Korea 647,320 1.8 324 18,416 10,487
A-Tech Solution1 1,592,000 15.9 26,348 11,606 17,830
SFA 1,822,000 10.2 38,262 85,998 111,142
KT Skylife 240,000 0.5 3,000 8,028 6,576
ASML 12,595,575 3.0 726,024 856,253 -
CSR 9,925,000 4.9 59,612 58,765 -
Rambus1 4,788,125 4.3 92,682 24,976 41,692
Seagate Technology 45,239,490 12.0 788,454 1,474,032 855,665
Others (*) - - 35,809 44,943 81,874
₩2,091,369 ₩4,435,856 ₩2,526,187
(*) The impairment loss of ₩85,280 million is recognized relating to A-Tech Solution and Rambus,etc. as the fair value decreased steadily below the acquisition cost.
The dierence between the acquisition cost and the current fair value, after income tax eects, is recorded within other components of equity (unrealized gains or
losses on available-for-sale nancial assets).
7574