Samsung 2012 Annual Report Download - page 41
Download and view the complete annual report
Please find page 41 of the 2012 Samsung annual report below. You can navigate through the pages in the report by either clicking on the pages listed below, or by using the keyword search tool below to find specific information within the annual report.-
 1
1 -
2
-
3
-
4
-
5
-
6
-
7
-
8
-
9
-
10
-
11
-
12
-
13
-
14
-
15
-
16
-
17
-
18
-
19
-
20
-
21
-
22
-
23
-
24
-
25
-
26
-
27
-
28
-
29
-
30
-
 31
31 -
 32
32 -
 33
33 -
 34
34 -
 35
35 -
 36
36 -
 37
37 -
 38
38 -
 39
39 -
 40
40 -
 41
41 -
 42
42 -
 43
43 -
 44
44 -
 45
45 -
 46
46 -
 47
47 -
 48
48 -
 49
49 -
 50
50 -
 51
51 -
52
-
53
-
54
-
55
-
56
-
57
-
58
-
59
-
60
 |
 |
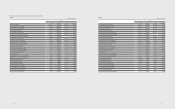
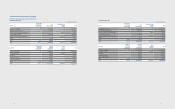
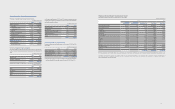
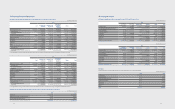
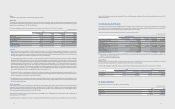
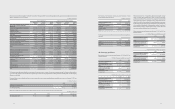
11. Inventories
Inventories as of December 31, 2012 and 2011, are as follows:
(In millions of Korean won)
2012 2011
Gross Amount Valuation
Allowance Book Value Gross Amount Valuation
Allowance Book Value
Finished goods ₩7,003,826 ₩(166,576) ₩6,837,250 ₩6,105,312 ₩(199,432) ₩5,905,880
Work in Process 3,623,572 (392,996) 3,230,576 3,454,823 (383,461) 3,071,362
Raw materials and supplies 5,239,262 (157,866) 5,081,396 4,673,143 (186,523) 4,486,620
Materials-in-transit 2,598,191 - 2,598,191 2,252,853 - 2,252,853
₩18,464,851 ₩(717,438) ₩17,747,413 ₩16,486,131 ₩(769,416) ₩15,716,715
The inventories recognized as expense and included in ‘cost of sales’ amounted to₩125,746,083 million (2011: ₩110,802,871 million) in which inventory valuation
loss of ₩367,279 million (2011: ₩575,332 million) is included.
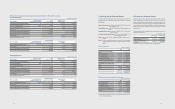
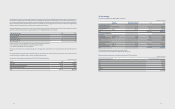
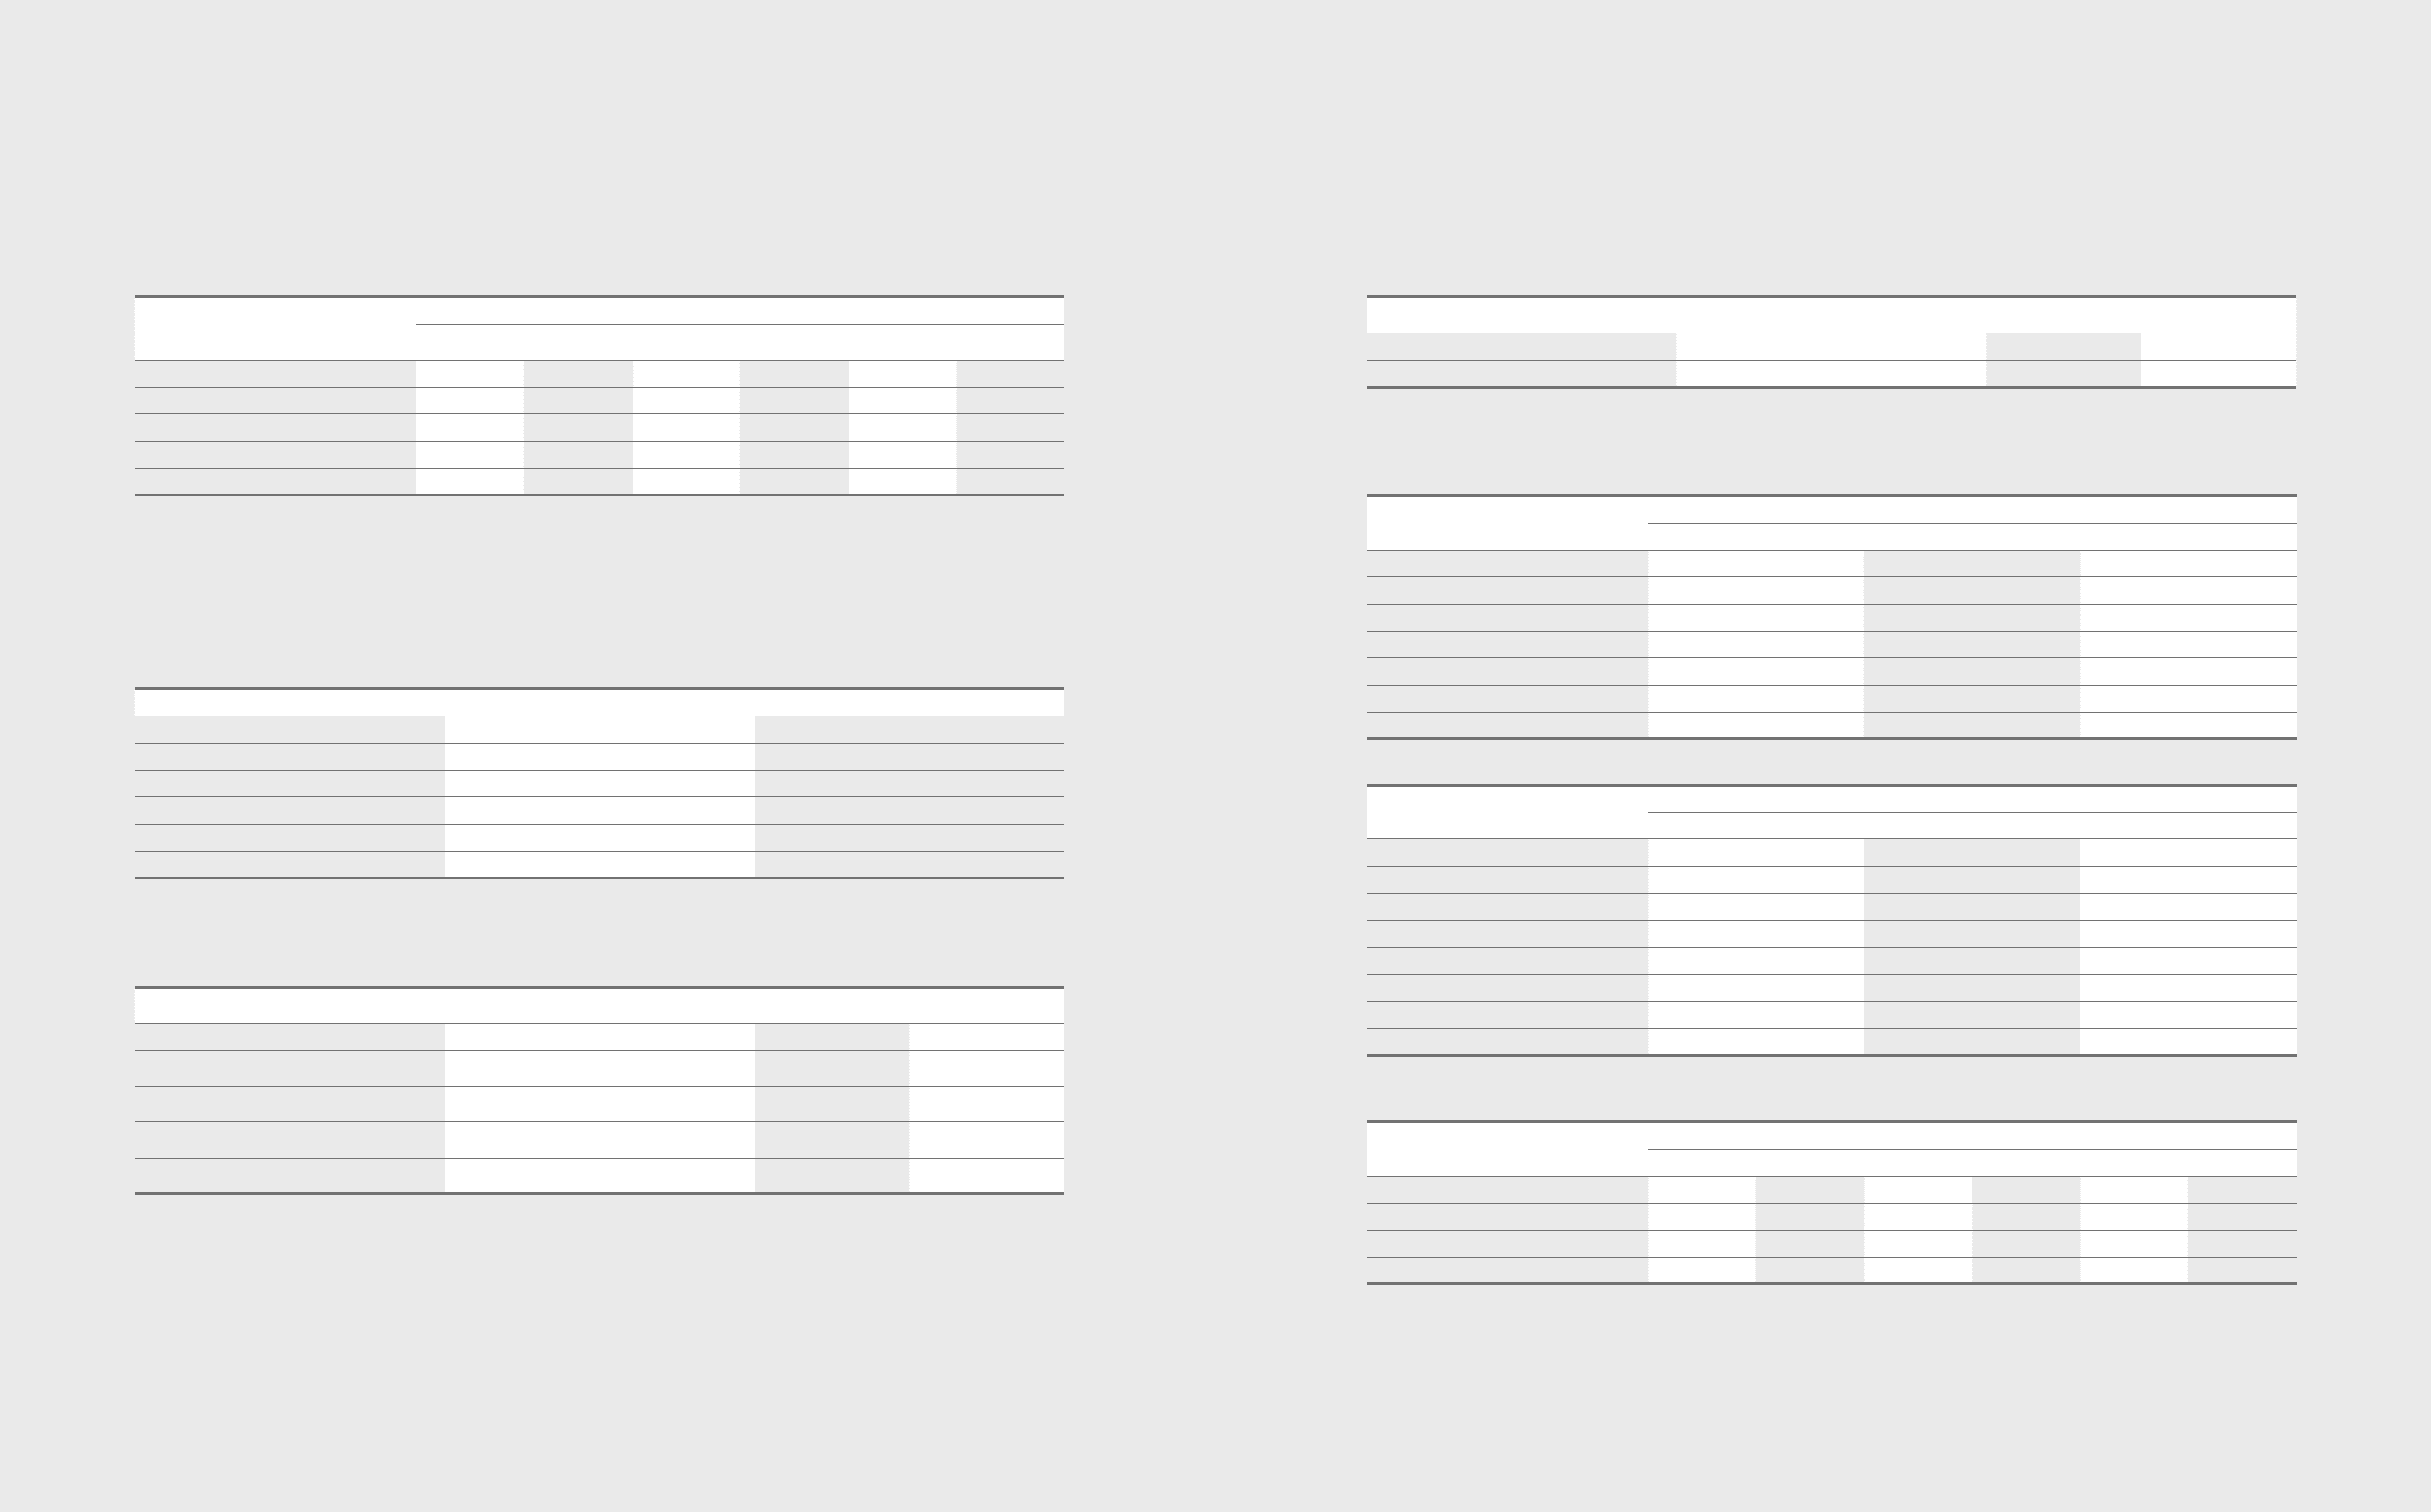
12. Associates and Joint Ventures
(A) Changes in investments in associates and joint ventures for the years ended December 31, 2012 and 2011, are as follows:
(In millions of Korean won)
2012 2012
Balance at January 1 ₩9,204,169 ₩8,335,290
Acquisition 279,022 403,538
Disposal (21,891) (298,375)
Share of prot 986,611 1,399,194
Others (*) (1,662,422) (635,478)
Balance at December 31 ₩8,785,489 ₩9,204,169
(*) Others consist of dividends, business combination, and the eect of change in foreign exchange rates, etc.
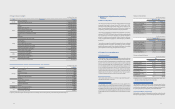
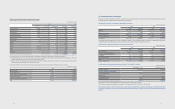
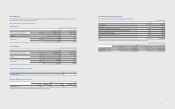
(B) Major associates and Joint Ventures as of December 31, 2012, consist of the following:
(1) Associates
(In millions of Korean won)
Investee Industry Percentage of
Ownership (%) (*)
Percentage of
Ownership (%) (*)
Samsung Card Finance 37.5 Korea
Samsung Electro-Mechanics Manufacture of electronic components, computers,
videos, sound and communication equipments 23.7 Korea
Samsung SDI Manufacture of electronic components, computers,
videos, sound and communication equipments 20.4 Korea
Samsung SDS Computer programming, system integration and
management 21.7 Korea
Samsung Techwin Manufacture of electronic components, computers,
videos, sound and communication equipments 25.5 Korea
(*) The ownership represents the Company’s ownership of the voting rights in the entity.
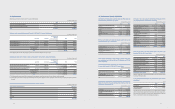
(2) Joint ventures
(In millions of Korean won)
Investee Industry Percentage of
Ownership (%) (*)
Percentage of
Ownership (%) (*)
Samsung Corning Precision Materials TFT- LCD components Manufacturing and retail 42.5 Korea
Samsung Corning Advanced Glass Manufacture of other industrial glass devices 50.0 Korea
(*)The ownership represents the Company’s ownership of the voting rights in the entity.
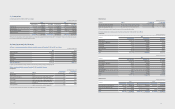
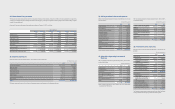
(C) Details of investments in associates and joint ventures as of December 31, 2012 and 2011 are as follows:
(1) Associates
(In millions of Korean won)
Investee
2012
Acquisition cost Net asset value Book value
Samsung Card ₩1,538,540 ₩2,221,201 ₩2,238,073
Samsung Electro-Mechanics 359,237 887,933 890,460
Samsung SDI 423,722 1,450,811 1,174,183
Samsung SDS 17,967 689,874 701,808
Samsung Techwin 174,531 401,146 360,739
Others 461,599 513,580 457,016
Total ₩2,975,596 ₩6,164,545 ₩5,822,279
(In millions of Korean won)
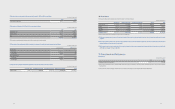
Investee
2011
Acquisition cost Net asset value Book value
Samsung Card ₩1,538,540 ₩2,167,986 ₩2,184,855
Samsung Electro-Mechanics 359,237 883,680 799,792
Samsung SDI 423,722 1,242,699 1,185,509
Samsung SDS 17,967 643,578 632,593
Samsung Techwin 174,531 417,708 370,379
Samsung LED 180,916 311,545 340,145
Others 269,787 354,602 371,909
Total ₩2,964,700 ₩6,021,798 ₩5,885,182
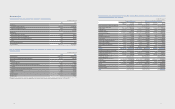
(2) Joint ventures
(In millions of Korean won)
Investee
2012 2011
Acquisition cost Net asset value Book value Acquisition cost Net asset value Book value
Samsung Corning Precision Materials ₩297,165 ₩2,825,104 ₩2,794,617 ₩297,165 ₩3,191,077 ₩3,089,298
Samsung Corning Advanced Glass 115,000 114,274 114,274 - - -
Others 419,461 64,193 54,319 419,461 145,870 229,689
Total ₩831,626 ₩3,003,571 ₩2,963,210 ₩716,626 ₩3,336,947 ₩3,318,987
7978