Samsung 2012 Annual Report Download - page 25
Download and view the complete annual report
Please find page 25 of the 2012 Samsung annual report below. You can navigate through the pages in the report by either clicking on the pages listed below, or by using the keyword search tool below to find specific information within the annual report.-
 1
1 -
2
-
3
-
4
-
5
-
6
-
7
-
8
-
9
-
10
-
11
-
12
-
13
-
14
-
 15
15 -
 16
16 -
 17
17 -
 18
18 -
 19
19 -
 20
20 -
 21
21 -
 22
22 -
 23
23 -
 24
24 -
 25
25 -
 26
26 -
 27
27 -
 28
28 -
 29
29 -
 30
30 -
 31
31 -
 32
32 -
 33
33 -
 34
34 -
 35
35 -
36
-
37
-
38
-
39
-
40
-
41
-
42
-
43
-
44
-
45
-
46
-
47
-
48
-
49
-
50
-
51
-
52
-
53
-
54
-
55
-
56
-
57
-
58
-
59
-
60
 |
 |
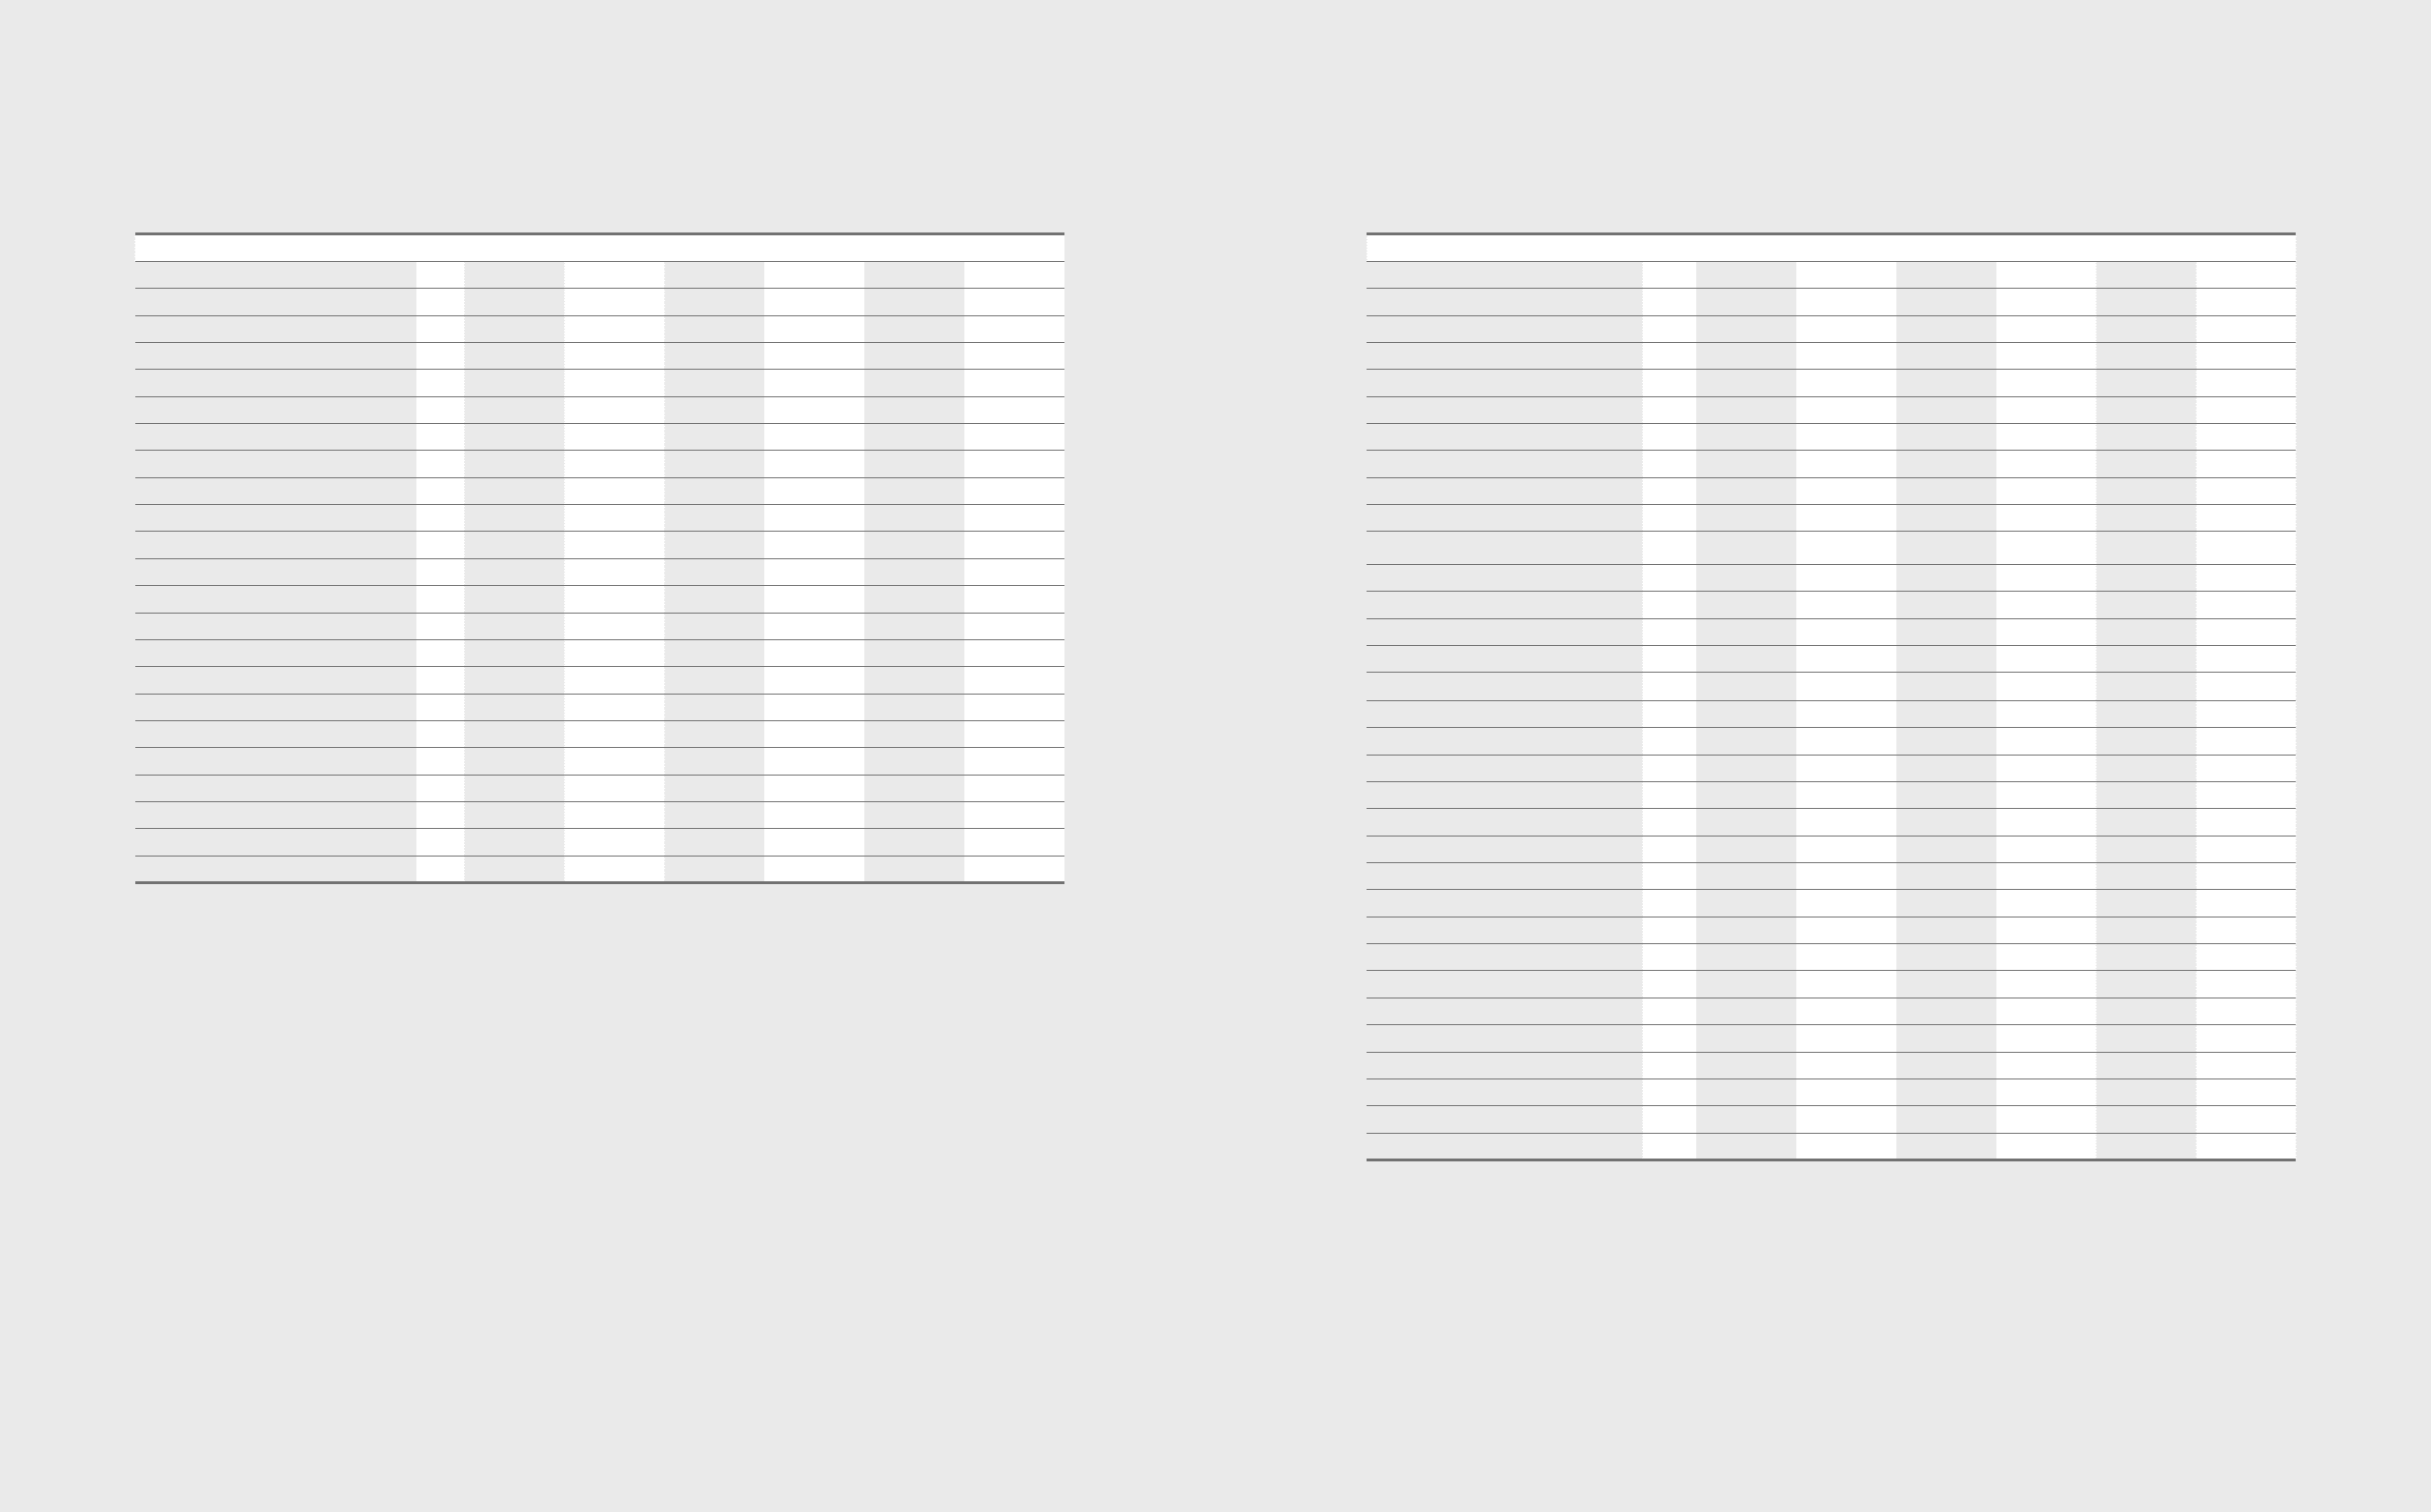
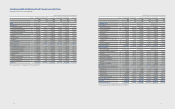
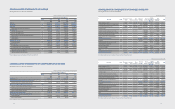
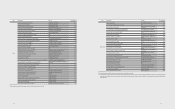
CONSOLIDATED STATEMENTS OF FINANCIAL POSITION
Samsung Electronics Co., Ltd. and its subsidiaries
(In millions of Korean won, in thousands of U.S dollars (Note 2.28))
Notes December 31 December 31 January 1 December 31 December 31 January 1
2012 2011 2011 2012 2011 2011
KRW KRW KRW USD USD USD
Assets
Current Assets
Cash and cash equivalents 4, 6, 7 18,791,460 14,691,761 9,791,419 17,544,076 13,716,517 9,141,461
Short-term nancial instruments 5, 6, 7 17,397,937 11,529,905 11,529,392 16,243,056 10,764,546 10,764,067
Available-for-sale nancial assets 6, 9 1,258,874 655,969 1,159,152 1,175,309 612,426 1,082,207
Trade and other receivables 6, 7, 10 26,674,596 24,153,028 21,308,834 24,903,927 22,549,741 19,894,346
Advances 1,674,428 1,436,288 1,302,428 1,563,279 1,340,947 1,215,972
Prepaid expenses 2,262,234 2,329,463 2,200,739 2,112,066 2,174,832 2,054,653
Inventories 11 17,747,413 15,716,715 13,364,524 16,569,333 14,673,434 12,477,382
Other current assets 6 1,462,075 988,934 746,101 1,365,023 923,288 696,575
Total current assets 87,269,017 71,502,063 61,402,589 81,476,069 66,755,731 57,326,663
Non-current assets
Available-for-sale nancial assets 6, 9 5,229,175 3,223,598 3,040,206 4,882,060 3,009,614 2,838,396
Associates and joint ventures 12 8,785,489 9,204,169 8,335,290 8,202,305 8,593,193 7,781,990
Property, plant and equipment 13 68,484,743 62,043,951 52,964,594 63,938,701 57,925,451 49,448,785
Intangible assets 14 3,729,705 3,355,236 2,779,439 3,482,126 3,132,514 2,594,939
Deposits 6814,693 791,863 655,662 760,613 739,299 612,139
Long-term prepaid expenses 3,515,479 3,454,205 3,544,572 3,282,120 3,224,914 3,309,282
Deferred income tax assets 29 2,516,080 1,783,086 1,144,068 2,349,062 1,664,724 1,068,124
Other non-current assets 6 727,189 442,092 442,383 678,919 412,746 413,018
Total assets 181,071,570 155,800,263 134,308,803 169,051,975 145,458,186 125,393,336
The accompanying notes are an integral part of these nancial statements.
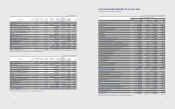
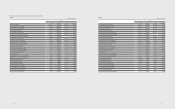
(In millions of Korean won, in thousands of U.S dollars (Note 2.28))
Notes December 31 December 31 January 1 December 31 December 31 January 1
2012 2011 2011 2012 2011 2011
KRW KRW KRW USD USD USD
Liabilities and Equity
Current liabilities
Trade and other payables 6 16,889,350 18,509,490 16,049,800 15,768,229 17,280,823 14,984,409
Short-term borrowings 6,15 8,443,752 9,653,722 8,429,721 7,883,253 9,012,904 7,870,153
Advance received 1,517,672 1,450,733 883,585 1,416,928 1,354,433 824,932
Withholdings 966,374 1,715,070 1,052,555 902,226 1,601,223 982,686
Accrued expenses 6 9,495,156 7,823,728 7,102,427 8,864,864 7,304,386 6,630,965
Income tax payable 3,222,934 1,262,798 2,051,452 3,008,994 1,178,973 1,915,276
Current portion of long-term borrowings
and debentures 6, 15, 16 999,010 30,292 1,123,934 932,695 28,281 1,049,327
Provisions 18 5,054,853 3,514,536 2,917,919 4,719,310 3,281,240 2,724,226
Other current liabilities 6 343,951 358,645 333,328 321,120 334,839 311,202
Total current liabilities 46,933,052 44,319,014 39,944,721 43,817,619 41,377,102 37,293,176
Non-current liabilities
Non-current liabilities
Long-term trade and other payables 6 1,165,881 1,024,804 1,072,661 1,088,489 956,777 1,001,457
Debentures 6, 16 1,829,374 1,280,124 587,338 1,707,940 1,195,149 548,350
Long-term borrowings 6, 15 3,623,028 3,682,472 634,381 3,382,530 3,438,028 592,271
Retirement benet liabilities 17 1,729,939 1,119,188 823,486 1,615,105 1,044,896 768,823
Deferred income tax liabilities 29 3,429,467 2,333,442 1,618,523 3,201,818 2,178,547 1,511,085
Provisions 18 408,529 363,223 295,357 381,411 339,112 275,751
Other non-current liabilities 6 472,094 364,366 154,700 440,757 340,180 144,431
Total liabilities 59,591,364 54,486,633 45,131,167 55,635,669 50,869,791 42,135,344
Equity attributable to owners of the parent
Preferred stock 20 119,467 119,467 119,467 111,537 111,537 111,537
Common stock 20 778,047 778,047 778,047 726,400 726,400 726,400
Share premium 20 4,403,893 4,403,893 4,403,893 4,111,561 4,111,561 4,111,561
Retained earnings 21 119,985,689 97,622,872 85,071,444 112,020,996 91,142,630 79,424,371
Other components of equity 23 (8,193,044) (5,833,896) (4,931,290) (7,649,185) (5,446,639) (4,603,949)
Non-controlling interests 4,386,154 4,223,247 3,736,075 4,094,997 3,942,906 3,488,072
Total equity 121,480,206 101,313,630 89,177,636 113,416,306 94,588,395 83,257,992
Total liabilities and equity 181,071,570 155,800,263 134,308,803 169,051,975 145,458,186 125,393,336
The accompanying notes are an integral part of these nancial statements.
4746