Samsung 2012 Annual Report Download - page 42
Download and view the complete annual report
Please find page 42 of the 2012 Samsung annual report below. You can navigate through the pages in the report by either clicking on the pages listed below, or by using the keyword search tool below to find specific information within the annual report.-
 1
1 -
2
-
3
-
4
-
5
-
6
-
7
-
8
-
9
-
10
-
11
-
12
-
13
-
14
-
15
-
16
-
17
-
18
-
19
-
20
-
21
-
22
-
23
-
24
-
25
-
26
-
27
-
28
-
29
-
30
-
31
-
 32
32 -
 33
33 -
 34
34 -
 35
35 -
 36
36 -
 37
37 -
 38
38 -
 39
39 -
 40
40 -
 41
41 -
 42
42 -
 43
43 -
 44
44 -
 45
45 -
 46
46 -
 47
47 -
 48
48 -
 49
49 -
 50
50 -
 51
51 -
 52
52 -
53
-
54
-
55
-
56
-
57
-
58
-
59
-
60
 |
 |
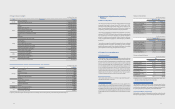
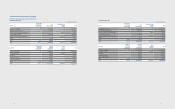
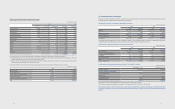
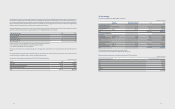
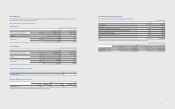
(D) Gain/loss on valuation of equity
(1) 2012
(In millions of Korean won)
Balance at
January 1
Gain/loss on
valuation
Other
comprehensive
gains
Others (*) Balance on
December 31
Samsung Card ₩2,184,855 ₩264,688 ₩(181,217) ₩(30,253) ₩2,238,073
Samsung Electro-Mechanics 799,792 102,946 11,689 (23,967) 890,460
Samsung SDI 1,185,509 31,256 (30,531) (12,051) 1,174,183
Samsung SDS 632,593 89,157 (16,488) (3,454) 701,808
Samsung Techwin 370,379 39,356 (27,171) (21,825) 360,739
Samsung LED 340,145 (22,519) (712) (316,914) -
Samsung Corning Precision Materials 3,089,298 644,242 (10,300) (928,623) 2,794,617
Samsung Corning Advanced Glass - (726) - 115,000 114,274
Others 601,598 (161,789) (95,761) 167,287 511,335
Total ₩9,204,169 ₩986,611 ₩(350,491) ₩(1,054,800) ₩8,785,489
(*) Others include acquisitions, disposals, dividends and changes in currency exchange rates.
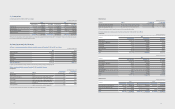
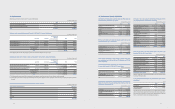
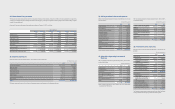
(2) 2011
(In millions of Korean won)
Balance at
January 1
Gain/loss on
valuation
Other
comprehensive
gains
Others (*) Balance on
December 31
Samsung Card ₩2,201,154 ₩132,331 ₩(80,800) ₩(67,830) ₩2,184,855
Samsung Electro-Mechanics 793,932 78,179 (50,307) (22,012) 799,792
Samsung SDI 1,172,130 63,242 (11,274) (38,589) 1,185,509
Samsung SDS 569,678 74,382 (2,939) (8,528) 632,593
Samsung Techwin 269,360 65,684 42,245 (6,910) 370,379
Samsung LED 306,005 30,669 3,471 - 340,145
Samsung Corning Precision Materials 2,599,010 975,221 (7,588) (477,345) 3,089,298
Others 424,021 (20,514) (6,706) 204,797 601,598
Total ₩8,335,290 ₩1,399,194 ₩(113,898) ₩(416,417) ₩9,204,169
(*) Others include acquisitions, disposals, dividends and changes in currency exchange rates.
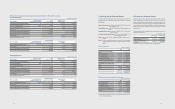
(E) Summarized financials of associates and joint ventures as of and for the year ended December 31, 2012 and 2011, are as follows:
(1) Associates
(In millions of Korean won)
Investee
2012 2011
Assets Liabilities Sales Net Income Assets Liabilities Sales Net Income
Samsung Card ₩16,287,816 ₩10,357,253 ₩3,817,670 ₩749,875 ₩16,135,253 ₩9,991,910 ₩3,196,455 ₩374,831
Samsung Electro-Mechanics 6,891,464 2,925,816 7,912,830 440,803 7,455,731 3,579,943 7,624,623 349,473
Samsung SDI 10,895,087 3,330,606 5,771,185 1,471,502 8,527,411 2,212,884 5,443,883 320,109
Samsung SDS 4,465,407 1,220,467 6,105,858 395,805 4,027,597 1,057,695 4,765,178 324,767
Samsung Techwin 3,240,938 1,663,263 2,934,702 131,324 3,223,454 1,582,808 3,171,532 241,014
Samsung LED - - 367,423 (51,164) 1,454,193 831,104 1,292,245 64,783
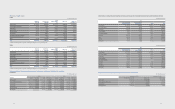
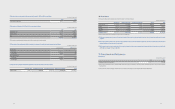
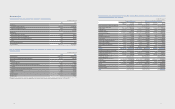
(2) Joint Ventures - A listing of interests in significant joint ventures and the proportion of ownership interest held in jointly controlled entities is as follows:
(In millions of Korean won)
2012
Samsung Corning
Precision Materials
Samsung Corning
Advanced Glass Others Total
Current assets ₩1,457,132 ₩93,842 ₩179,238 ₩1,730,212
Non-current assets 1,585,498 25,834 336,801 1,948,133
Total assets 3,042,630 119,676 516,039 3,678,345
Current liabilities 183,321 5,351 153,440 342,112
Non-current liabilities 34,205 51 298,406 332,662
Net assets 2,825,104 114,274 64,193 3,003,571
Sales 1,465,702 17,913 724,437 2,208,052
Expense 889,924 18,639 788,540 1,697,103
Net income 575,778 (726) (64,103) 510,949
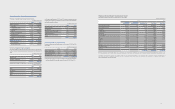
(In millions of Korean won)
2011
Samsung Corning
Precision Materials
Siltronic
Samsung Wafer Others Total
Current assets ₩1,759,181 ₩100,952 ₩176,899 ₩2,037,032
Non-current assets 1,742,956 343,751 40,346 2,127,053
Total assets 3,502,137 444,703 217,245 4,164,085
Current liabilities 251,287 76,932 138,217 466,436
Non-current liabilities 59,773 300,929 - 360,702
Net assets 3,191,077 66,842 79,028 3,336,947
Total sales 2,066,427 157,084 749,809 2,973,320
Total expense 1,086,094 194,764 740,522 2,021,380
Net income 980,333 (37,680) 9,287 951,940
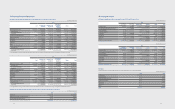
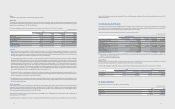
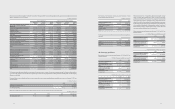
(F) Market value information of publicly listed associates as of December 31, 2012 is as follows:
(In millions of Korean won)
December 31, 2012 December 31, 2011
Number of shares held Market value Market value
Samsung SDI ₩9,282,753 ₩1,401,696 ₩1,239,248
Samsung Electro-Mechanics 17,693,084 1,755,154 1,374,753
Samsung Card 43,393,170 1,583,851 1,687,994
Samsung Techwin 13,526,935 807,558 719,633
8180