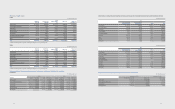
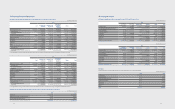
Samsung 2012 Annual Report Download - page 50
Download and view the complete annual report
Please find page 50 of the 2012 Samsung annual report below. You can navigate through the pages in the report by either clicking on the pages listed below, or by using the keyword search tool below to find specific information within the annual report.-
 1
1 -
2
-
3
-
4
-
5
-
6
-
7
-
8
-
9
-
10
-
11
-
12
-
13
-
14
-
15
-
16
-
17
-
18
-
19
-
20
-
21
-
22
-
23
-
24
-
25
-
26
-
27
-
28
-
29
-
30
-
31
-
32
-
33
-
34
-
35
-
36
-
37
-
38
-
39
-
 40
40 -
 41
41 -
 42
42 -
 43
43 -
 44
44 -
 45
45 -
 46
46 -
 47
47 -
 48
48 -
 49
49 -
 50
50 -
 51
51 -
 52
52 -
 53
53 -
 54
54 -
 55
55 -
 56
56 -
 57
57 -
 58
58 -
 59
59 -
 60
60
 |
 |
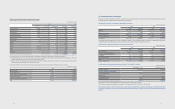
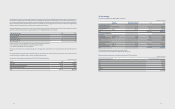
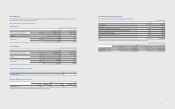
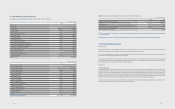
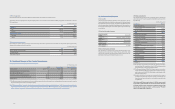
29. Income Tax
(A) Income tax expense for the years ended December 31, 2012 and 2011, consists of the following:
(In millions of Korean won)
2012 2011
Current taxes :
Current tax on prots for the year ₩5,656,298 ₩3,051,406
Adjustments in respect of prior years 95,296 95,670
5,751,594 3,147,076
Deferred taxes :
Deferred income taxes - tax credit 235,640 (75,311)
Deferred income taxes - temporary dierence 19,885 381,715
Deferred income taxes - accumulated operating loss (850) (22,599)
Others 60,654 -
Items charged directly to equity 2,809 1,994
Income tax expense ₩6,069,732 ₩3,432,875
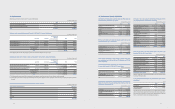
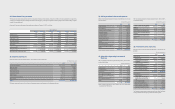
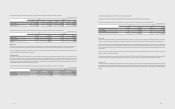
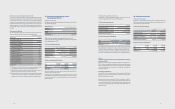
(B) The tax on the Company’s profit before tax differs from the theoretical amount that would arise using the weighted average tax rate applicable to profits of
the Company as follows:
(In millions of Korean won)
2012 2011
Income before tax ₩29,915,017 ₩17,191,918
Tax calculated at weighted average tax rates applicable (*) 7,664,722 4,354,162
Tax eects of:
Permanent dierence (161,762) (393,004)
Temporary dierences for which no deferred income tax was recognized (7,930) 7,309
Tax credit (1,980,710) (1,633,452)
Subsidiaries, associates and interests in joint ventures 650,000 906,505
Impact of changes in tax rates (3,602) 140,181
Other (90,986) 51,174
Income tax expense ₩6,069,732 ₩3,432,875
Eective tax rate 20.29% 19.97%
(*) Weighted average statutory tax rates that are applied dierently for the prots of the Company at each tax authority as of December 31, 2012 and 2011.
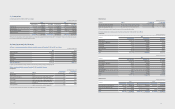
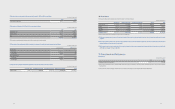
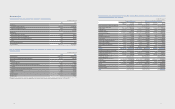
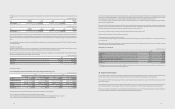
(C) Deferred income tax assets and liabilities resulting from the tax effect of temporary differences including available tax credit carryforwards and undisposed
accumulated deficit as of December 31, 2012, are as follows:
(In millions of Korean won)
Temporary Dierences Deferred Income Tax Assets (Liabilities)
Beginning
Balance
Increase
(Decrease)
Ending
Balance
Beginning
Balance
Increase
(Decrease)
Ending
Balance
Deferred tax arising from temporary dierences
Special reserves appropriated
for tax purposes ₩(18,146) ₩(14,951) ₩(33,097) ₩ (4,391) ₩(3,619) ₩(8,010)
Revaluation of land (4,017,316) 539,625 (3,477,691) (972,191) 130,590 (841,601)
Subsidiaries, associates
and interests in joint ventures (13,450,537) (11,813,329) (25,263,866) (3,032,268) (650,000) (3,682,268)
Depreciation 26,975 1,229,250 1,256,225 (52,318) 250,219 197,901
Capitalized interest expense (40,522) 21,690 (18,832) (9,806) 5,249 (4,557)
Accrued income (92,953) (31,224) (124,177) (21,337) (6,826) (28,163)
Provisions, accrued expenses and others 7,144,431 3,217,777 10,362,208 1,806,514 750,331 2,556,845
Foreign currency translation 150,908 (164,168) (13,260) 35,482 (41,449) (5,967)
Impairment losses on investments 52,901 37,755 90,656 10,937 5,587 16,524
Others 779,626 (1,673,860) (894,234) 288,217 (459,967) (171,750)
Subtotal ₩(9,464,633) ₩(8,651,435) ₩(18,116,068) ₩(1,951,161) ₩(19,885) ₩(1,971,046)
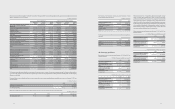
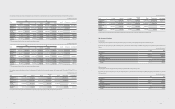
Deferred tax assets arising from carryforwards
Undisposed accumulated decit ₩100,401 ₩30,591 ₩130,992 ₩26,961 ₩850 ₩27,811
Tax credit carryforwards 1,512,052 (195,543) 1,316,509 1,495,747 (235,640) 1,260,107
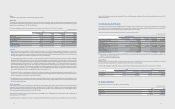
Deferred items recognized in other
comprehensive income
Valuation of available-for-sale nancial
instruments ₩(1,316,863) ₩(1,264,765) ₩(2,581,628) ₩(318,052) ₩(262,040) ₩ (580,092)
Actuarial valuation 813,514 657,804 1,471,318 196,149 153,684 349,833
Subtotal ₩(503,349) ₩(606,961) ₩(1,110,310) ₩(121,903) ₩(108,356) ₩(230,259)
Deferred tax assets ₩2,516,080
Deferred tax liabilities (3,429,467)
Total ₩(913,387)
9796