Samsung 2012 Annual Report Download - page 48
Download and view the complete annual report
Please find page 48 of the 2012 Samsung annual report below. You can navigate through the pages in the report by either clicking on the pages listed below, or by using the keyword search tool below to find specific information within the annual report.-
 1
1 -
2
-
3
-
4
-
5
-
6
-
7
-
8
-
9
-
10
-
11
-
12
-
13
-
14
-
15
-
16
-
17
-
18
-
19
-
20
-
21
-
22
-
23
-
24
-
25
-
26
-
27
-
28
-
29
-
30
-
31
-
32
-
33
-
34
-
35
-
36
-
37
-
 38
38 -
 39
39 -
 40
40 -
 41
41 -
 42
42 -
 43
43 -
 44
44 -
 45
45 -
 46
46 -
 47
47 -
 48
48 -
 49
49 -
 50
50 -
 51
51 -
 52
52 -
 53
53 -
 54
54 -
 55
55 -
 56
56 -
 57
57 -
 58
58 -
59
-
60
 |
 |
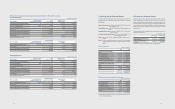
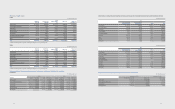
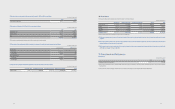
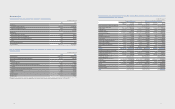
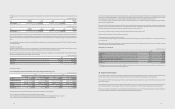
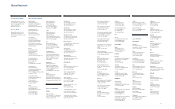
22. Dividends
SEC declared cash dividends to shareholders of common stock and preferred stock as interim dividends for the sixmonth periods ended June 30, 2012 and 2011 and as
year-end dividends for the years ended December 31, 2012 and 2011.
Details of interim dividends and year-end dividends are as follows:
(A) Interim Dividends
(In millions of Korean won and number of shares)
2012 2011
Number of shares eligible for dividends Common stock 130,759,755 shares 130,148,288 shares
Preferred stock 19,853,734 shares 19,853,734 shares
Dividend rate 10% 10%
Dividend amount
Common stock ₩65,380 ₩65,074
Preferred stock 9,927 9,927
Total ₩75,307 ₩75,001
(B) Year-end Dividends
(In millions of Korean won and number of shares)
2012 2011
Number of shares eligible for dividends Common stock 130,847,899 shares 130,386,723 shares
Preferred stock 19,853,734 shares 19,853,734 shares
Dividend rate Common stock 150% 100%
Preferred stock 151% 101%
Dividend amount
Common stock ₩981,359 ₩651,934
Preferred stock 149,896 100,261
Total ₩1,131,255 ₩752,195
(C) Dividend Payout Ratio (Including interim dividends).
2012 2011
Dividend payout ratio 5.20% 6.18%
(D) Dividend Yield Ratio (Including interim dividends)
2012 2011
Common StockPreferred Stock Common StockPreferred Stock
Dividend yield ratio (*) 0.54% 0.95% 0.52% 0.85%
(*) The average closing price in the stock market for a week before 2 trading days prior to dividend date.
9392
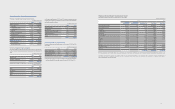
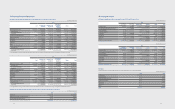
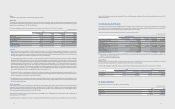
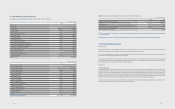
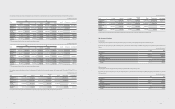
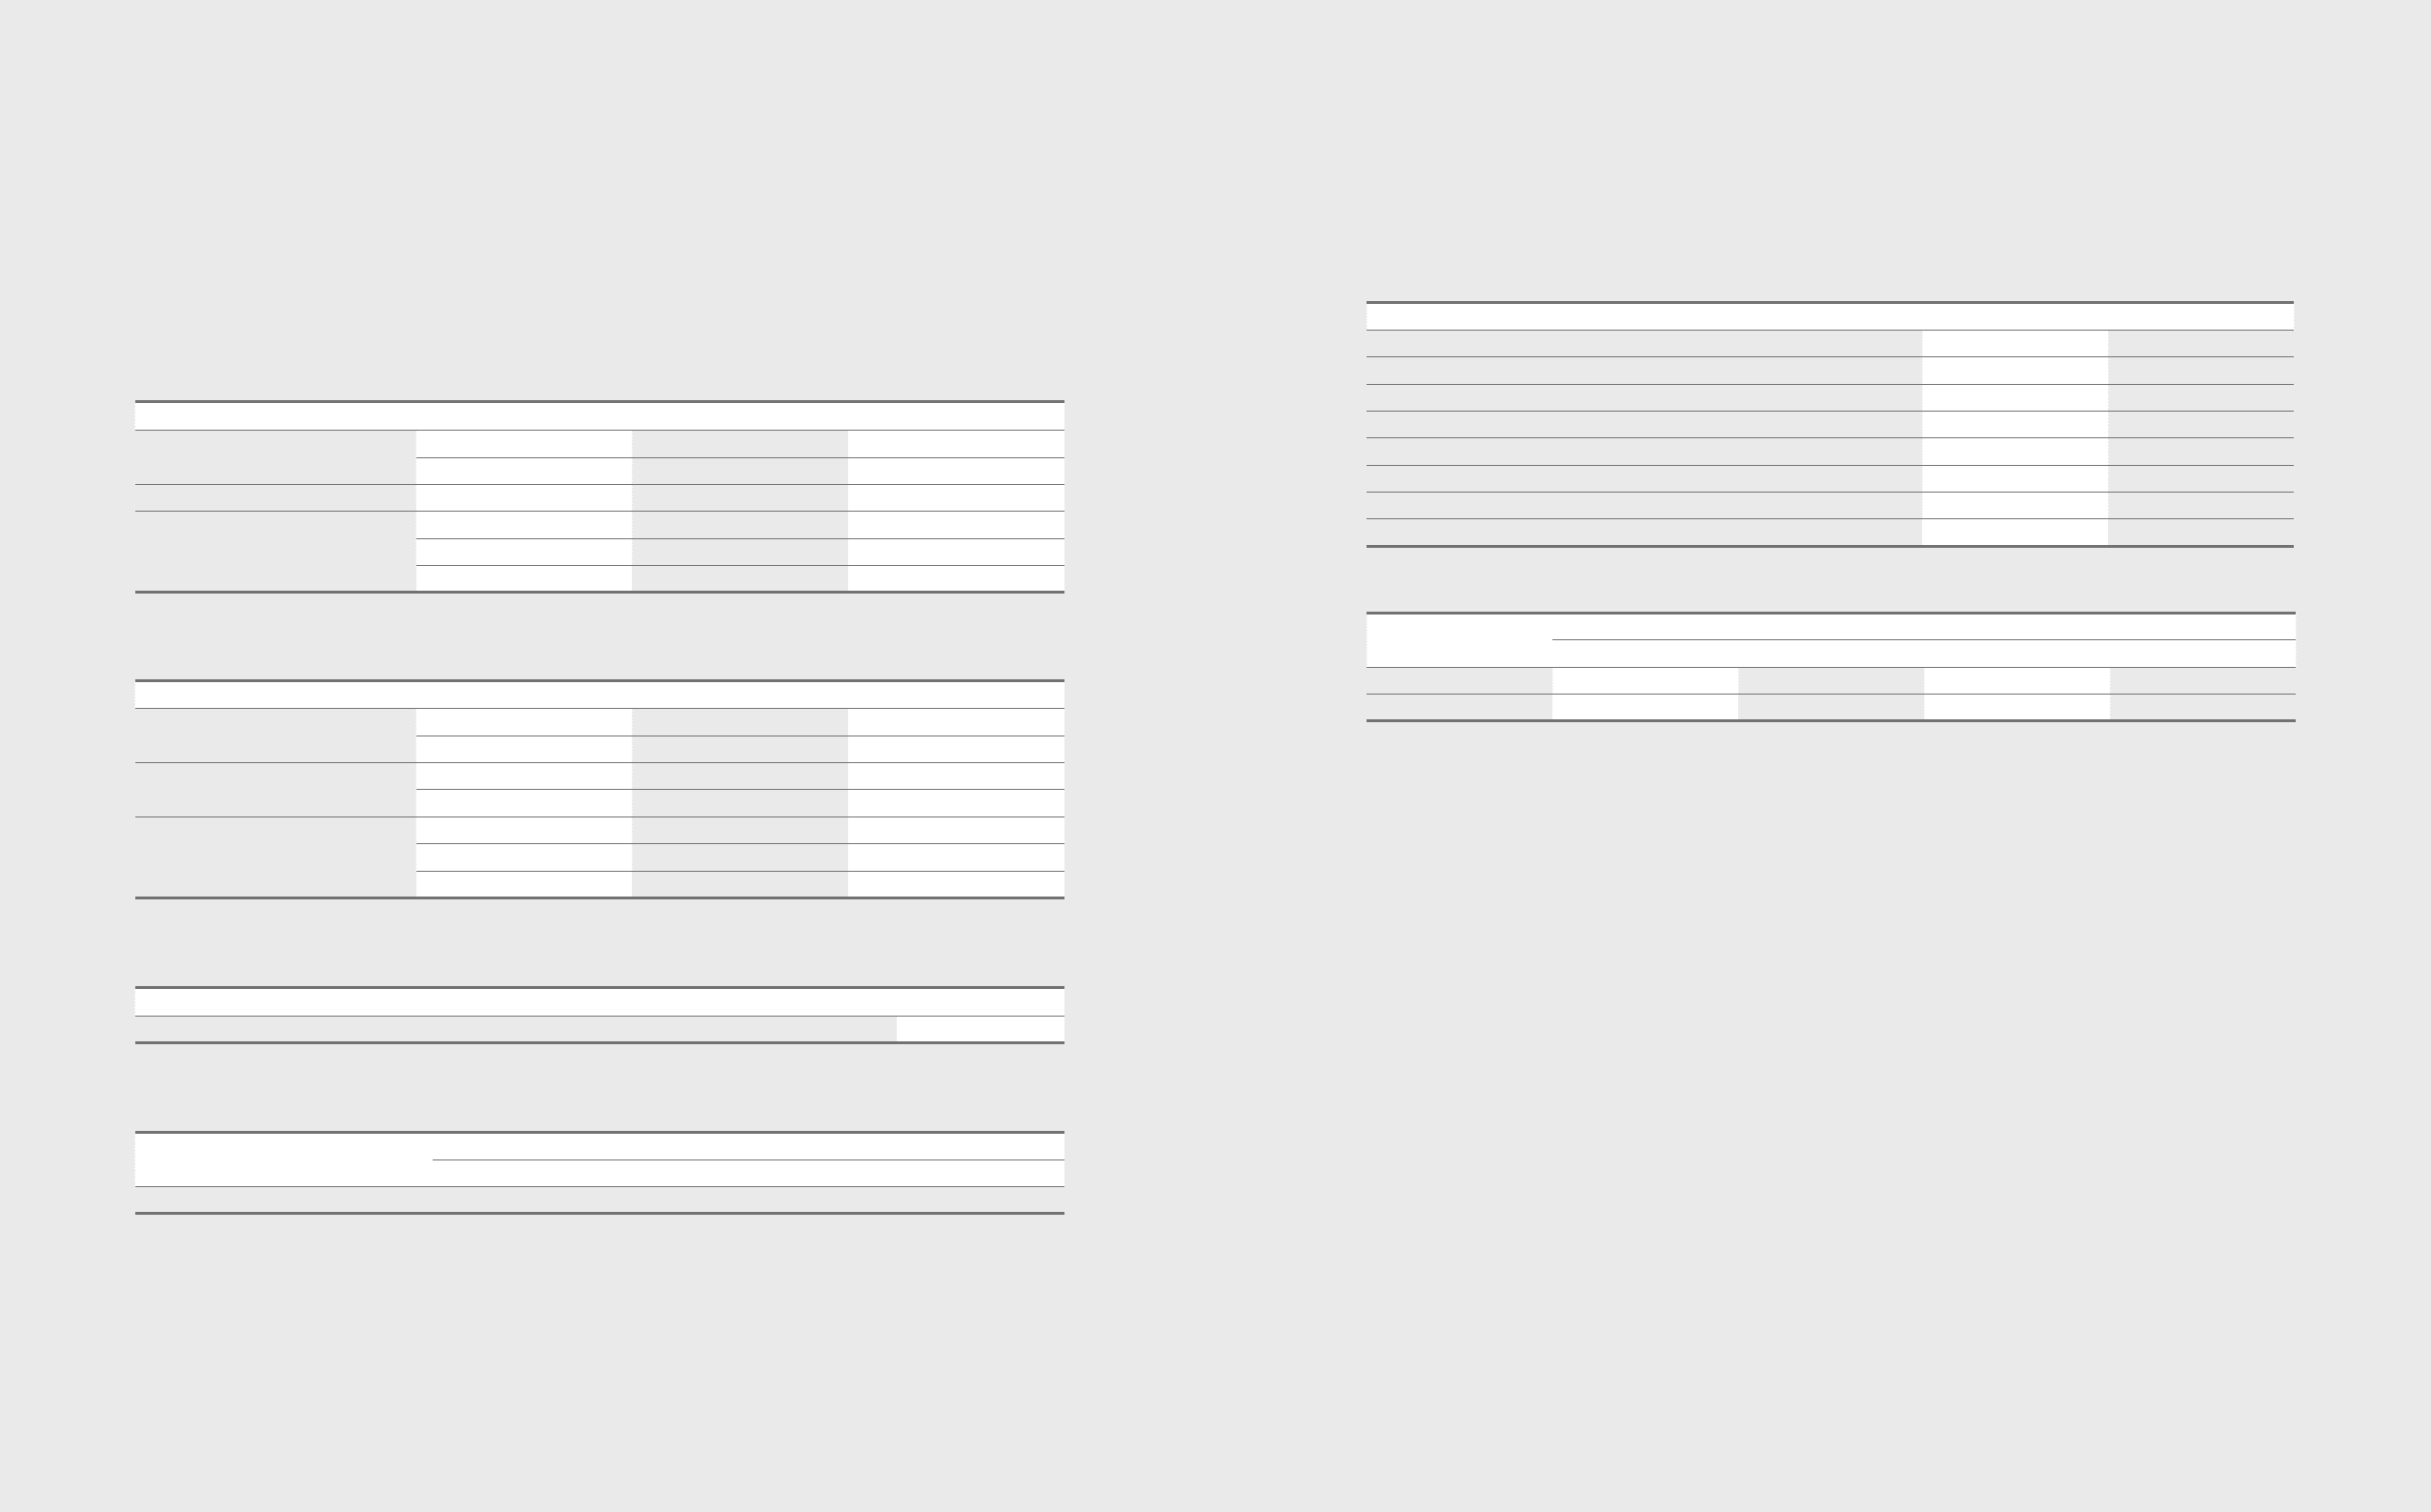
23. Other Components of Equity
Other components of equity as of December 31, 2012 and 2011, consist of the following:
(In millions of Korean won)
2012 2011
Treasury stock (*) ₩(7,350,927) ₩(7,539,561)
Stock option 22,242 55,313
Unrealized gains on available-for-sale nancial assets 2,001,536 1,040,849
Share of associates and joint ventures accumulated other comprehensive gains 720,944 1,071,435
Foreign-currency translation dierences (2,623,963) (834,086)
Remeasurement impact of employee benet (1,097,228) (590,877)
Others 134,352 963,031
Total ₩(8,193,044) ₩(5,833,896)
(*) As of December 31, 2012, the Company holds 16,451,438 common shares and 2,979,693 preferred shares as treasury stock.
(In millions of Korean won and number of shares)
2012 2011
Preferred Stock Common Stock Preferred Stock Common Stock
Number of shares 2,979,693 shares 16,451,438 shares 2,979,693 shares 16,912,614 shares
Acquisition cost ₩621,843 ₩6,729,084 ₩621,843 ₩6,917,718