Samsung 2012 Annual Report Download - page 37
Download and view the complete annual report
Please find page 37 of the 2012 Samsung annual report below. You can navigate through the pages in the report by either clicking on the pages listed below, or by using the keyword search tool below to find specific information within the annual report.-
 1
1 -
2
-
3
-
4
-
5
-
6
-
7
-
8
-
9
-
10
-
11
-
12
-
13
-
14
-
15
-
16
-
17
-
18
-
19
-
20
-
21
-
22
-
23
-
24
-
25
-
26
-
 27
27 -
 28
28 -
 29
29 -
 30
30 -
 31
31 -
 32
32 -
 33
33 -
 34
34 -
 35
35 -
 36
36 -
 37
37 -
 38
38 -
 39
39 -
 40
40 -
 41
41 -
 42
42 -
 43
43 -
 44
44 -
 45
45 -
 46
46 -
 47
47 -
48
-
49
-
50
-
51
-
52
-
53
-
54
-
55
-
56
-
57
-
58
-
59
-
60
 |
 |
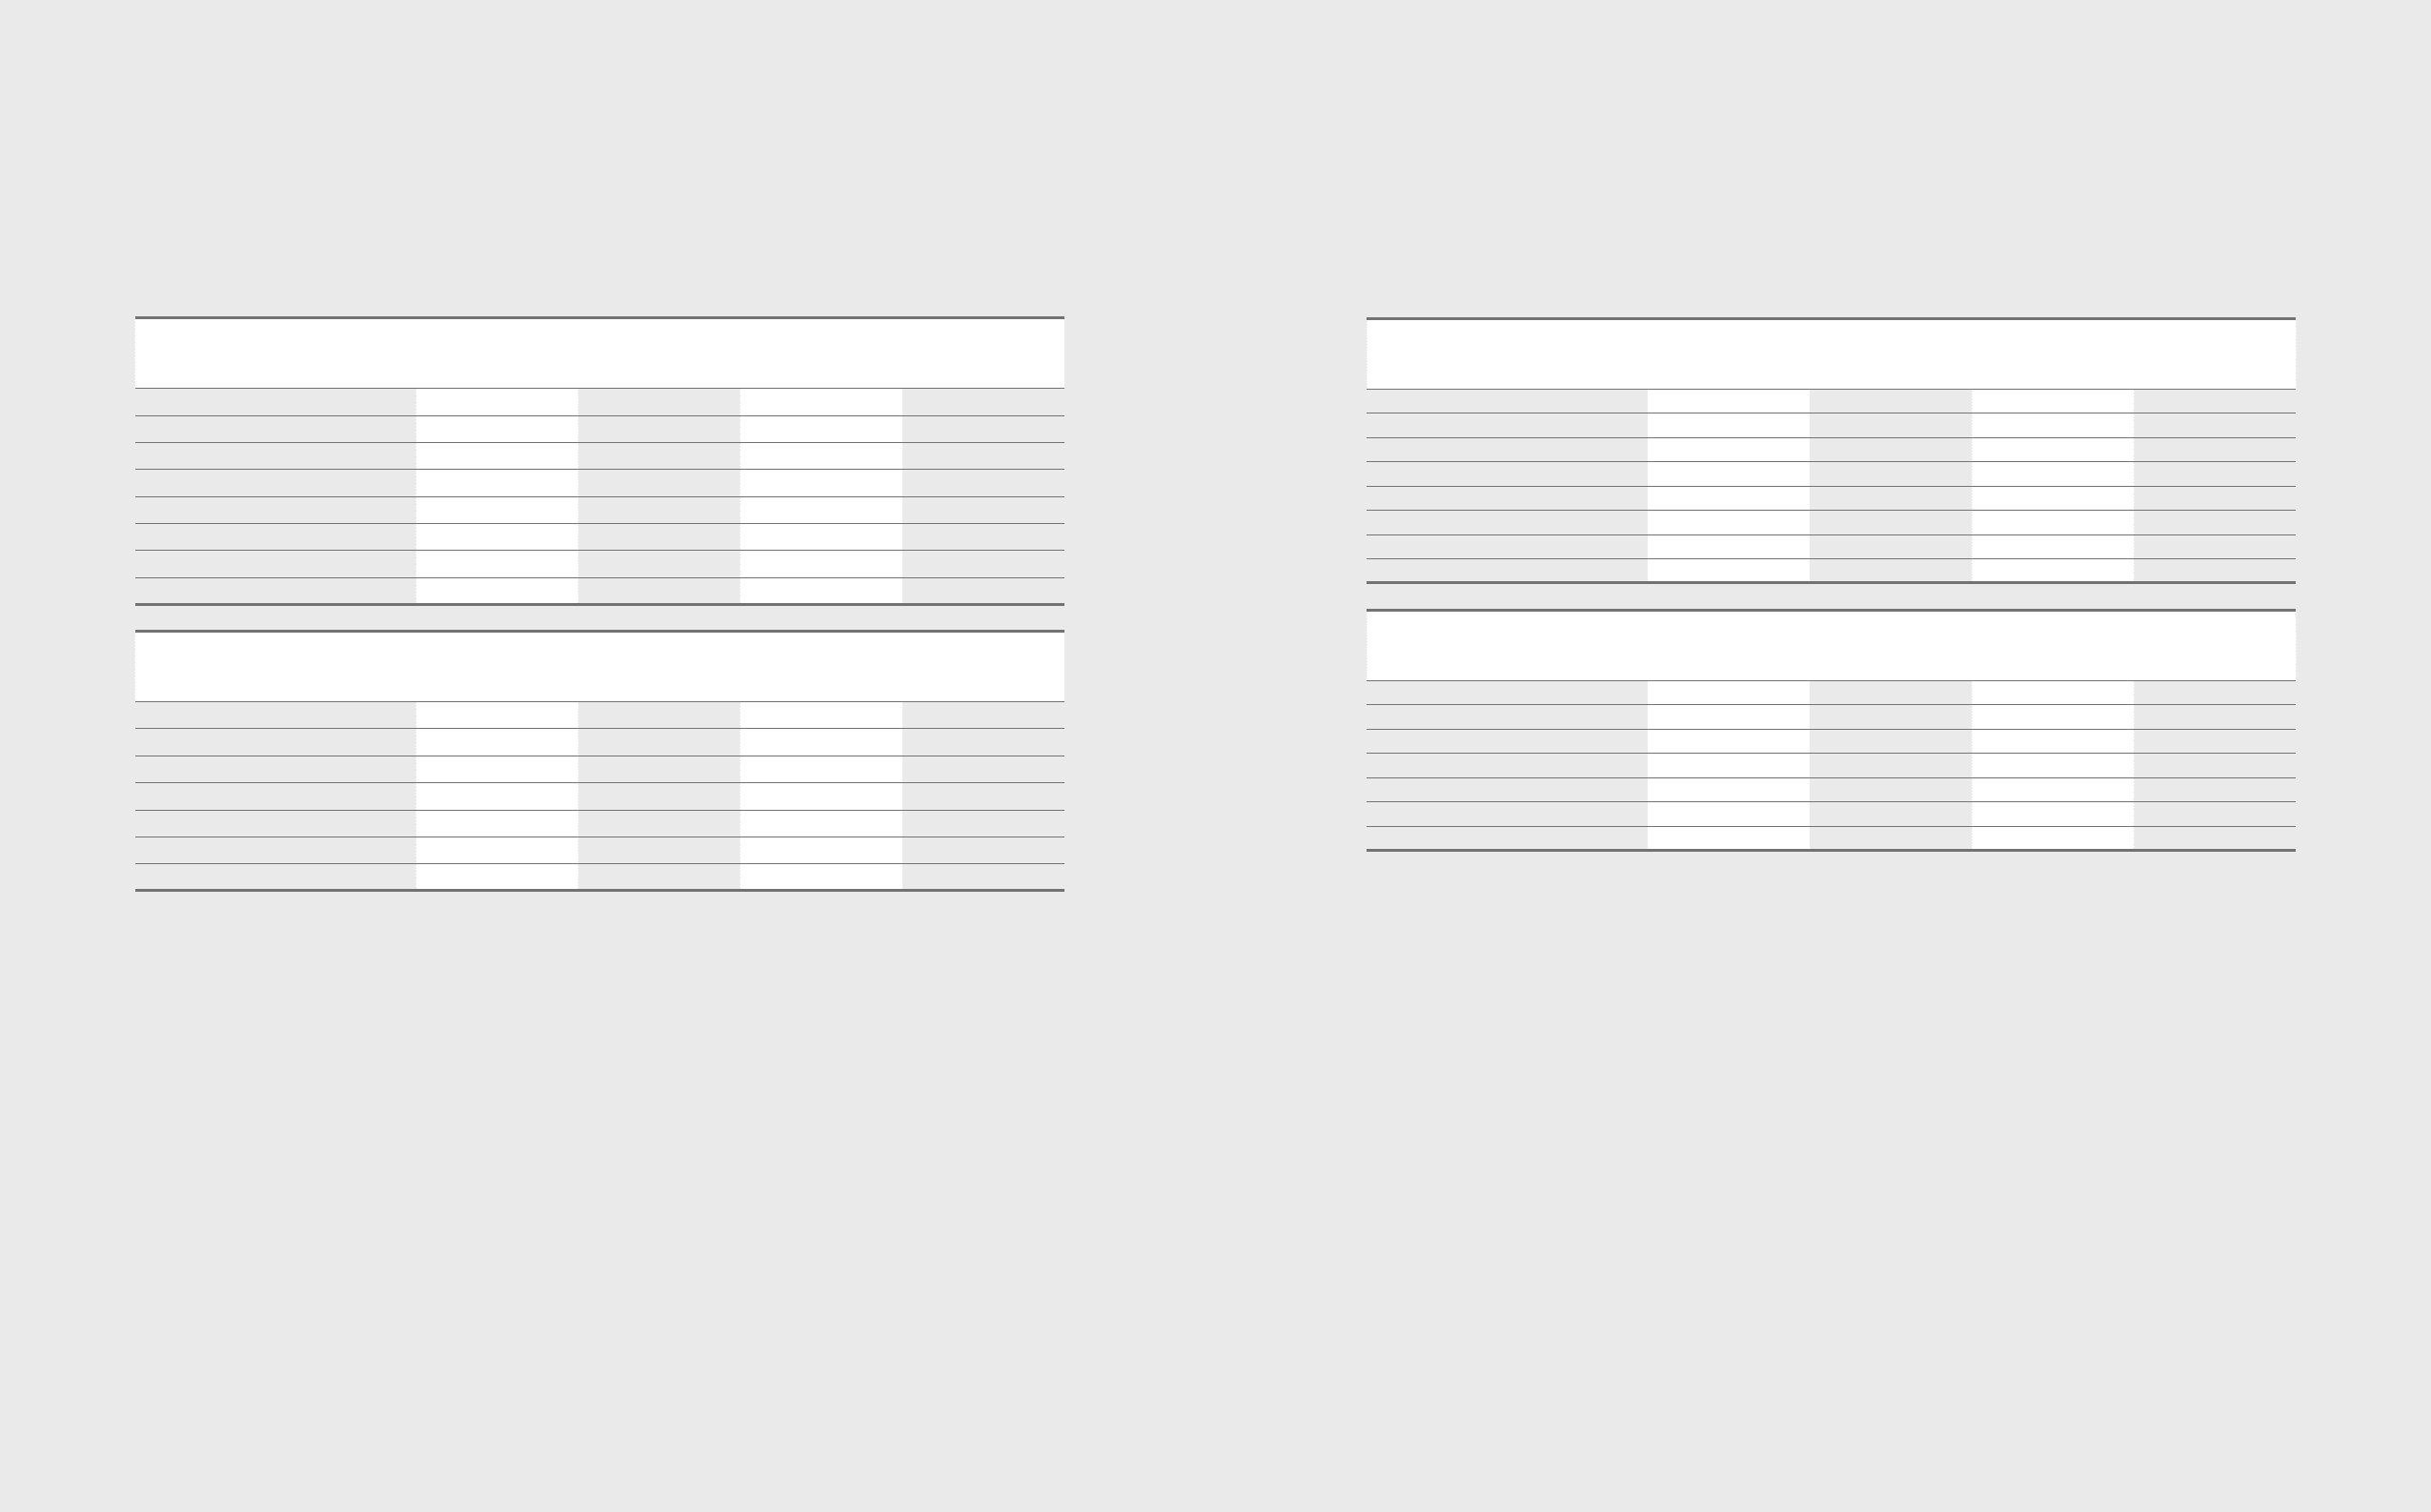
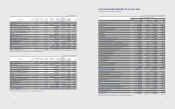
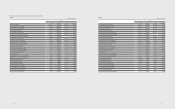
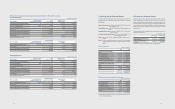
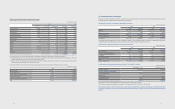
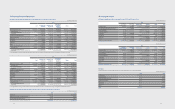
(2) As of December 31, 2011
(In millions of Korean won)
Assets
Assets at fair
value through
the prot and
loss
Loans
and receivables
Available-for-sale
nancial
assets
Total
Cash and cash equivalents ₩-₩14,691,761 ₩-₩14,691,761
Short-term nancial instruments - 11,529,905 - 11,529,905
Short-term available-for-sale nancial assets - - 655,969 655,969
Trade and other receivables - 24,153,028 - 24,153,028
Long-term available-for-sale nancial assets - - 3,223,598 3,223,598
Deposits - 791,863 - 791,863
Others 130,057 1,289,447 - 1,419,504
Total ₩130,057 ₩52,456,004 ₩3,879,567 ₩56,465,628
Liabilities
Liabilities at
fair value
through the
prot and loss
Financial
liabilities
measured at
amortized cost
Other
nancial
liabilities
Total
Trade and other payables ₩-₩18,509,490 ₩-₩18,509,490
Short-term borrowings - 4,775,339 4,878,383 9,653,722
Debentures - 1,280,124 - 1,280,124
Long-term borrowings - 3,682,472 - 3,682,472
Long-term other payables - 1,024,804 - 1,024,804
Others 40,932 7,818,742 - 7,859,674
Total ₩40,932 ₩37,090,971 ₩4,878,383 ₩42,010,286
7170
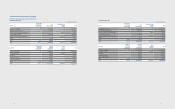
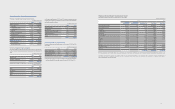
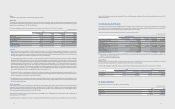
6. Financial Instruments by Category
(A) Financial instruments by category consist of the following:
(1) As of December 31, 2012
(In millions of Korean won)
Assets
Assets at fair
value through
the prot and
loss
Loans
and receivables
Available-for-sale
nancial
assets
Total
Cash and cash equivalents ₩-₩18,791,460 ₩-₩18,791,460
Short-term nancial instruments - 17,397,937 - 17,397,937
Short-term available-for-sale nancial assets - - 1,258,874 1,258,874
Trade and other receivables - 26,674,596 - 26,674,596
Long-term available-for-sale nancial assets - - 5,229,175 5,229,175
Deposits - 814,693 - 814,693
Others 47,227 2,056,988 - 2,104,215
Total ₩47,227 ₩65,735,674 ₩6,488,049 ₩72,270,950
Liabilities
Liabilities at
fair value
through the
prot and loss
Financial
liabilities
measured at
amortized cost
Other
nancial
liabilities
Total
Trade and other payables ₩ - ₩16,889,350 ₩-₩16,889,350
Short-term borrowings - 4,115,249 4,328,503 8,443,752
Debentures - 1,829,374 - 1,829,374
Long-term borrowings - 3,623,028 - 3,623,028
Long-term other payables - 1,165,881 - 1,165,881
Others 79,212 10,788,823 - 10,868,035
Total ₩79,212 ₩38,411,705 ₩4,328,503 ₩42,819,420