Regions Bank 2009 Annual Report Download - page 86
Download and view the complete annual report
Please find page 86 of the 2009 Regions Bank annual report below. You can navigate through the pages in the report by either clicking on the pages listed below, or by using the keyword search tool below to find specific information within the annual report.-
 1
1 -
2
-
3
-
4
-
5
-
6
-
7
-
8
-
9
-
10
-
11
-
12
-
13
-
14
-
15
-
16
-
17
-
18
-
19
-
20
-
21
-
22
-
23
-
24
-
25
-
26
-
27
-
28
-
29
-
30
-
31
-
32
-
33
-
34
-
35
-
36
-
37
-
38
-
39
-
40
-
41
-
42
-
43
-
44
-
45
-
46
-
47
-
48
-
49
-
50
-
51
-
52
-
53
-
54
-
55
-
56
-
57
-
58
-
59
-
60
-
61
-
62
-
63
-
64
-
65
-
66
-
67
-
68
-
69
-
70
-
71
-
72
-
73
-
74
-
75
-
 76
76 -
 77
77 -
 78
78 -
 79
79 -
 80
80 -
 81
81 -
 82
82 -
 83
83 -
 84
84 -
 85
85 -
 86
86 -
 87
87 -
 88
88 -
 89
89 -
 90
90 -
 91
91 -
 92
92 -
 93
93 -
 94
94 -
 95
95 -
 96
96 -
97
-
98
-
99
-
100
-
101
-
102
-
103
-
104
-
105
-
106
-
107
-
108
-
109
-
110
-
111
-
112
-
113
-
114
-
115
-
116
-
117
-
118
-
119
-
120
-
121
-
122
-
123
-
124
-
125
-
126
-
127
-
128
-
129
-
130
-
131
-
132
-
133
-
134
-
135
-
136
-
137
-
138
-
139
-
140
-
141
-
142
-
143
-
144
-
145
-
146
-
147
-
148
-
149
-
150
-
151
-
152
-
153
-
154
-
155
-
156
-
157
-
158
-
159
-
160
-
161
-
162
-
163
-
164
-
165
-
166
-
167
-
168
-
169
-
170
-
171
-
172
-
173
-
174
-
175
-
176
-
177
-
178
-
179
-
180
-
181
-
182
-
183
-
184
-
185
-
186
-
187
-
188
-
189
-
190
-
191
-
192
-
193
-
194
-
195
-
196
-
197
-
198
-
199
-
200
-
201
-
202
-
203
-
204
-
205
-
206
-
207
-
208
-
209
-
210
-
211
-
212
-
213
-
214
-
215
-
216
-
217
-
218
-
219
-
220
 |
 |
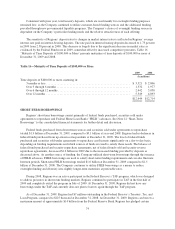
indicated that the Company’s goodwill was not impaired. See Note 1 “Summary of Significant Accounting
Policies” and Note 9 “Intangible Assets” to the consolidated financial statements for additional details.
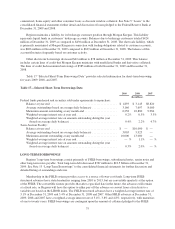
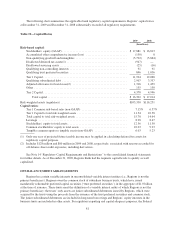
Mortgage Servicing Rights
Mortgage servicing rights at December 31, 2009 totaled $247 million compared to $161 million at
December 31, 2008. A summary of mortgage servicing rights is presented in Note 7 “Transfers and Servicing of
Financial Assets” to the consolidated financial statements. The balances shown represent the right to service
mortgage loans that are owned by other investors. Mortgage servicing rights are presented at fair value and at
cost, less amortization and impairment, as of December 31, 2009 and 2008 respectively. During 2008, the
Company sold mortgage servicing rights on approximately $3.4 billion of GNMA loans and recognized a loss of
$15 million, including transaction costs.
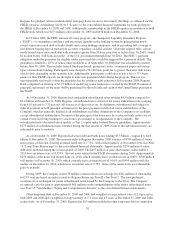
On January 1, 2009, Regions began accounting for mortgage servicing rights at fair market value with any
changes to fair value being recorded within mortgage income. Also, in early 2009, Regions entered into
derivative and trading asset transactions to mitigate the impact of market value fluctuations related to mortgage
servicing rights. Derivative instruments entered into in the future could be materially different from the current
risk profile of Regions’ current portfolio. See the “Mortgage Income” section earlier in this report for detail
regarding the effect of MSRs and related hedging items on Regions’ consolidated statement of operations.
Other Identifiable Intangible Assets
Other identifiable intangible assets, consisting primarily of core deposit intangibles, totaled $503 million at
December 31, 2009 compared to $638 million at December 31, 2008. The year-over-year decline is mainly the
result of amortization. Regions noted no indicators of impairment for any other identifiable intangible assets. See
Note 9 “Intangible Assets” to the consolidated financial statements for further information.
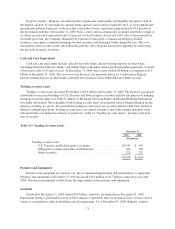
Other Assets
Other assets decreased $45 million to $7.9 billion as of December 31, 2009. This decrease is primarily
related to a lower level of derivatives used by the Company for hedging purposes, offset by an increase in
foreclosed properties and prepaids related to FDIC premiums.
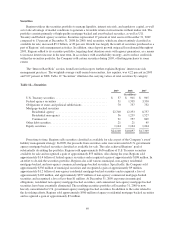
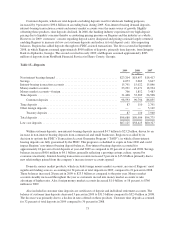
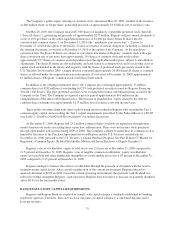
DEPOSITS
Regions competes with other banking and financial services companies for a share of the deposit market.
Regions’ ability to compete in the deposit market depends heavily on the pricing of its deposits and how
effectively the Company meets customers’ needs. Regions employs various means to meet those needs and
enhance competitiveness, such as providing a high level of customer service, competitive pricing and expanding
the traditional branch network to provide convenient branch locations for its customers. Regions also services
customers through providing centralized, high-quality telephone banking services and alternative product
delivery channels such as internet banking.
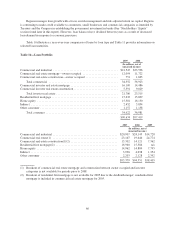
Deposits are Regions’ primary source of funds, providing funding for 75 percent of average interest-earning
assets in 2009 and 2008. Table 15 “Deposits” details year-over-year deposits on a period-ending basis. Total
deposits as of year-end 2009 increased $7.8 billion, or 9 percent, compared to year-end 2008. A key driver was
the increased growth in non-interest-bearing demand deposits, savings, interest-bearing transaction accounts and
domestic money market accounts. These increases were partially offset by decreasing foreign money market
accounts and time deposits. Regions continues to grow customer households, commercial and small business
relationships and deposits by deepening and retaining existing customer relationships as well as developing new
relationships through client acquisition, new checking products and money market rate offers.
72