Regions Bank 2009 Annual Report Download - page 83
Download and view the complete annual report
Please find page 83 of the 2009 Regions Bank annual report below. You can navigate through the pages in the report by either clicking on the pages listed below, or by using the keyword search tool below to find specific information within the annual report.-
 1
1 -
2
-
3
-
4
-
5
-
6
-
7
-
8
-
9
-
10
-
11
-
12
-
13
-
14
-
15
-
16
-
17
-
18
-
19
-
20
-
21
-
22
-
23
-
24
-
25
-
26
-
27
-
28
-
29
-
30
-
31
-
32
-
33
-
34
-
35
-
36
-
37
-
38
-
39
-
40
-
41
-
42
-
43
-
44
-
45
-
46
-
47
-
48
-
49
-
50
-
51
-
52
-
53
-
54
-
55
-
56
-
57
-
58
-
59
-
60
-
61
-
62
-
63
-
64
-
65
-
66
-
67
-
68
-
69
-
70
-
71
-
72
-
 73
73 -
 74
74 -
 75
75 -
 76
76 -
 77
77 -
 78
78 -
 79
79 -
 80
80 -
 81
81 -
 82
82 -
 83
83 -
 84
84 -
 85
85 -
 86
86 -
 87
87 -
 88
88 -
 89
89 -
 90
90 -
 91
91 -
 92
92 -
 93
93 -
94
-
95
-
96
-
97
-
98
-
99
-
100
-
101
-
102
-
103
-
104
-
105
-
106
-
107
-
108
-
109
-
110
-
111
-
112
-
113
-
114
-
115
-
116
-
117
-
118
-
119
-
120
-
121
-
122
-
123
-
124
-
125
-
126
-
127
-
128
-
129
-
130
-
131
-
132
-
133
-
134
-
135
-
136
-
137
-
138
-
139
-
140
-
141
-
142
-
143
-
144
-
145
-
146
-
147
-
148
-
149
-
150
-
151
-
152
-
153
-
154
-
155
-
156
-
157
-
158
-
159
-
160
-
161
-
162
-
163
-
164
-
165
-
166
-
167
-
168
-
169
-
170
-
171
-
172
-
173
-
174
-
175
-
176
-
177
-
178
-
179
-
180
-
181
-
182
-
183
-
184
-
185
-
186
-
187
-
188
-
189
-
190
-
191
-
192
-
193
-
194
-
195
-
196
-
197
-
198
-
199
-
200
-
201
-
202
-
203
-
204
-
205
-
206
-
207
-
208
-
209
-
210
-
211
-
212
-
213
-
214
-
215
-
216
-
217
-
218
-
219
-
220
 |
 |

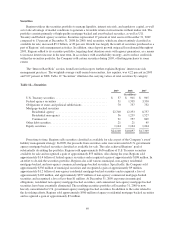
Securities
Regions utilizes the securities portfolio to manage liquidity, interest rate risk, and regulatory capital, as well
as to take advantage of market conditions to generate a favorable return on investments without undue risk. The
portfolio consists primarily of high-quality mortgage-backed and asset-backed securities, as well as U.S.
Treasury and Federal agency securities. Securities represented 17 percent of total assets at December 31, 2009
compared to 13 percent at December 31, 2008. In 2009, total securities, which are almost entirely classified as
available for sale, increased $5.2 billion, or 28 percent. Growth was largely the result of securities purchased as a
part of Regions’ risk management activities. In addition, since deposit growth outpaced loan demand throughout
2009, Regions added to its securities portfolio, targeting short duration assets with agency guarantees, as a means
to increase interest income in the near term. In accordance with asset/liability strategy, and to reduce credit risk
within the securities portfolio, the Company sold certain securities during 2009, offsetting purchases to some
extent.
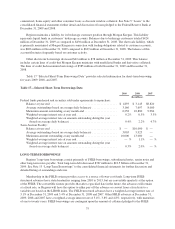
The “Interest Rate Risk” section, found later in this report, further explains Regions’ interest rate risk
management practices. The weighted-average yield earned on securities, less equities, was 4.22 percent in 2009
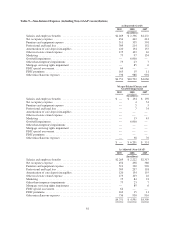
and 5.07 percent in 2008. Table 12 “Securities” illustrates the carrying values of total securities by category.
Table 12—Securities
2009 2008 2007
(In millions)
U.S. Treasury securities ................................... $ 57 $ 901 $ 965
Federal agency securities .................................. 51 1,705 3,330
Obligations of states and political subdivisions ................. 70 757 732
Mortgage-backed securities
Residential agency ................................... 22,700 12,353 8,757
Residential non-agency ............................... 36 1,239 1,527
Commercial ........................................ 21 757 809
Other debt securities ...................................... 21 21 45
Equity securities ......................................... 1,144 1,164 1,204
$24,100 $18,897 $17,369
From time to time, Regions sells securities classified as available for sale as part of the Company’s asset/
liability management strategy. In 2009, the proceeds from securities sales were reinvested in U.S. government
agency mortgage-backed securities classified as available for sale. The sales achieved Regions’ goal of
substantially de-risking the portfolio. Regions sold approximately $656 million of U.S. Treasury securities
available for sale and recognized a gain of approximately $53 million. Also during the year, Regions sold
approximately $1.4 billion of federal agency securities and recognized a gain of approximately $108 million. In
an effort to de-risk the securities portfolio, Regions also sold various municipal, non-agency residential
mortgage-backed, and non-agency commercial mortgage-backed securities. Specifically, the Company sold
approximately $336 million of municipal securities and recognized a gain of approximately $9 million,
approximately $1.2 billion of non-agency residential mortgage-backed securities and recognized a loss of
approximately $103 million, and approximately $877 million of non-agency commercial mortgage-backed
securities and recognized a loss of less than $1 million. At December 31, 2009 exposures in municipal
obligations, residential non-agency mortgage-backed securities, and commercial non-agency mortgage-backed
securities have been essentially eliminated. The resulting securities portfolio at December 31, 2009 is now
heavily concentrated in U.S. government agency mortgage-backed securities. In addition to the sales related to
the de-risking efforts, Regions sold approximately $500 million of agency residential mortgage-backed securities
and recognized a gain of approximately $3 million.
69