Regions Bank 2009 Annual Report Download - page 66
Download and view the complete annual report
Please find page 66 of the 2009 Regions Bank annual report below. You can navigate through the pages in the report by either clicking on the pages listed below, or by using the keyword search tool below to find specific information within the annual report.-
 1
1 -
2
-
3
-
4
-
5
-
6
-
7
-
8
-
9
-
10
-
11
-
12
-
13
-
14
-
15
-
16
-
17
-
18
-
19
-
20
-
21
-
22
-
23
-
24
-
25
-
26
-
27
-
28
-
29
-
30
-
31
-
32
-
33
-
34
-
35
-
36
-
37
-
38
-
39
-
40
-
41
-
42
-
43
-
44
-
45
-
46
-
47
-
48
-
49
-
50
-
51
-
52
-
53
-
54
-
55
-
 56
56 -
 57
57 -
 58
58 -
 59
59 -
 60
60 -
 61
61 -
 62
62 -
 63
63 -
 64
64 -
 65
65 -
 66
66 -
 67
67 -
 68
68 -
 69
69 -
 70
70 -
 71
71 -
 72
72 -
 73
73 -
 74
74 -
 75
75 -
 76
76 -
77
-
78
-
79
-
80
-
81
-
82
-
83
-
84
-
85
-
86
-
87
-
88
-
89
-
90
-
91
-
92
-
93
-
94
-
95
-
96
-
97
-
98
-
99
-
100
-
101
-
102
-
103
-
104
-
105
-
106
-
107
-
108
-
109
-
110
-
111
-
112
-
113
-
114
-
115
-
116
-
117
-
118
-
119
-
120
-
121
-
122
-
123
-
124
-
125
-
126
-
127
-
128
-
129
-
130
-
131
-
132
-
133
-
134
-
135
-
136
-
137
-
138
-
139
-
140
-
141
-
142
-
143
-
144
-
145
-
146
-
147
-
148
-
149
-
150
-
151
-
152
-
153
-
154
-
155
-
156
-
157
-
158
-
159
-
160
-
161
-
162
-
163
-
164
-
165
-
166
-
167
-
168
-
169
-
170
-
171
-
172
-
173
-
174
-
175
-
176
-
177
-
178
-
179
-
180
-
181
-
182
-
183
-
184
-
185
-
186
-
187
-
188
-
189
-
190
-
191
-
192
-
193
-
194
-
195
-
196
-
197
-
198
-
199
-
200
-
201
-
202
-
203
-
204
-
205
-
206
-
207
-
208
-
209
-
210
-
211
-
212
-
213
-
214
-
215
-
216
-
217
-
218
-
219
-
220
 |
 |
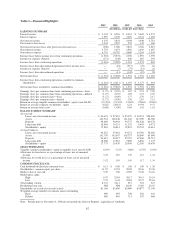
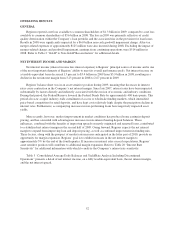
OPERATING RESULTS
GENERAL
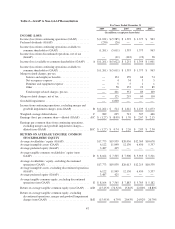
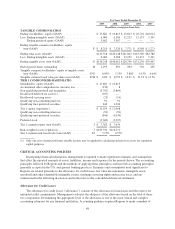
Regions reported a net loss available to common shareholders of $1.3 billion in 2009, compared to a net loss
available to common shareholders of $5.6 billion in 2008. The loss in 2009 was primarily reflective of credit
quality deterioration within the Company’s loan portfolio and the associated rise in the provision for loan losses.
Results in 2008 were significantly impacted by a $6.0 billion non-cash goodwill impairment charge. After-tax
merger-related expenses of approximately $125 million were also incurred during 2008. Excluding the impact of
merger-related charges and goodwill impairment, earnings from continuing operations were $514 million in
2008. Refer to Table 2 “GAAP to Non-GAAP Reconciliation” for additional details.
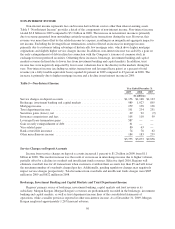
NET INTEREST INCOME AND MARGIN
Net interest income (interest income less interest expense) is Regions’ principal source of income and is one
of the most important elements of Regions’ ability to meet its overall performance goals. Net interest income on
a taxable-equivalent basis decreased 13 percent to $3.4 billion in 2009 from $3.9 billion in 2008, resulting in a
decline in the net interest margin from 3.23 percent in 2008 to 2.67 percent in 2009.
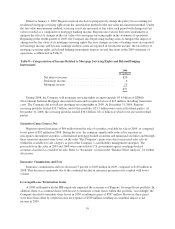
Regions’ balance sheet was in an asset sensitive position during 2009, meaning that decreases in interest
rates cause contraction in the Company’s net interest margin. Since late 2007, interest rates have been impacted
substantially by factors directly and indirectly associated with the erosion of economic and industry conditions.
During that period, the Federal Reserve lowered the Federal Funds Rate by approximately 400 basis points. This
period also saw a rapid, industry-wide curtailment of access to wholesale funding markets, which intensified
price-based competition for retail deposits, and have kept costs relatively high, despite the precipitous decline in
interest rates. Furthermore, accompanying increases in non-performing loans have negatively impacted asset
yields.
More recently, however, modest improvement in market conditions has produced some easing in deposit
pricing, and has coincided with advantageous increases in non-interest bearing deposit balances. These
influences, combined with the benefits of improving spreads on newly originated and renewed loans, contributed
to a stabilized net interest margin in the second half of 2009. Going forward, Regions expects the net interest
margin to expand from improving loan and deposit pricing, as well as continued improvement in funding mix.
These factors, along with the prospect of modest rate increases anticipated in the latter part of 2010, provide an
opportunity for margin expansion. Regions’ goal is to exhibit increases in the net interest margin to
approximately 3% by the end of the fourth quarter. If increases in interest rates exceed expectations, Regions’
asset sensitive position will contribute to additional margin expansion. Refer to Table 20 “Interest Rate
Sensitivity” for additional information with which to analyze the Company’s interest rate sensitivity.
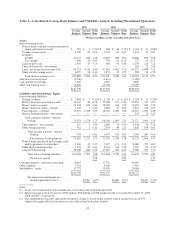
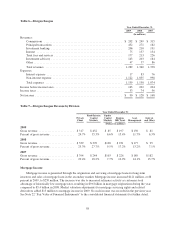
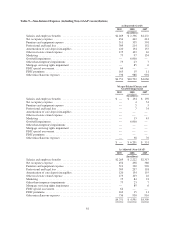
Table 3 “Consolidated Average Daily Balances and Yield/Rate Analysis Including Discontinued
Operations” presents a detail of net interest income, on a fully taxable-equivalent basis, the net interest margin,
and the net interest spread.
52