Regions Bank 2009 Annual Report Download - page 180
Download and view the complete annual report
Please find page 180 of the 2009 Regions Bank annual report below. You can navigate through the pages in the report by either clicking on the pages listed below, or by using the keyword search tool below to find specific information within the annual report.-
 1
1 -
2
-
3
-
4
-
5
-
6
-
7
-
8
-
9
-
10
-
11
-
12
-
13
-
14
-
15
-
16
-
17
-
18
-
19
-
20
-
21
-
22
-
23
-
24
-
25
-
26
-
27
-
28
-
29
-
30
-
31
-
32
-
33
-
34
-
35
-
36
-
37
-
38
-
39
-
40
-
41
-
42
-
43
-
44
-
45
-
46
-
47
-
48
-
49
-
50
-
51
-
52
-
53
-
54
-
55
-
56
-
57
-
58
-
59
-
60
-
61
-
62
-
63
-
64
-
65
-
66
-
67
-
68
-
69
-
70
-
71
-
72
-
73
-
74
-
75
-
76
-
77
-
78
-
79
-
80
-
81
-
82
-
83
-
84
-
85
-
86
-
87
-
88
-
89
-
90
-
91
-
92
-
93
-
94
-
95
-
96
-
97
-
98
-
99
-
100
-
101
-
102
-
103
-
104
-
105
-
106
-
107
-
108
-
109
-
110
-
111
-
112
-
113
-
114
-
115
-
116
-
117
-
118
-
119
-
120
-
121
-
122
-
123
-
124
-
125
-
126
-
127
-
128
-
129
-
130
-
131
-
132
-
133
-
134
-
135
-
136
-
137
-
138
-
139
-
140
-
141
-
142
-
143
-
144
-
145
-
146
-
147
-
148
-
149
-
150
-
151
-
152
-
153
-
154
-
155
-
156
-
157
-
158
-
159
-
160
-
161
-
162
-
163
-
164
-
165
-
166
-
167
-
168
-
169
-
 170
170 -
 171
171 -
 172
172 -
 173
173 -
 174
174 -
 175
175 -
 176
176 -
 177
177 -
 178
178 -
 179
179 -
 180
180 -
 181
181 -
 182
182 -
 183
183 -
 184
184 -
 185
185 -
 186
186 -
 187
187 -
 188
188 -
 189
189 -
 190
190 -
191
-
192
-
193
-
194
-
195
-
196
-
197
-
198
-
199
-
200
-
201
-
202
-
203
-
204
-
205
-
206
-
207
-
208
-
209
-
210
-
211
-
212
-
213
-
214
-
215
-
216
-
217
-
218
-
219
-
220
 |
 |

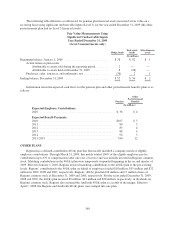
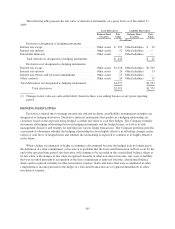
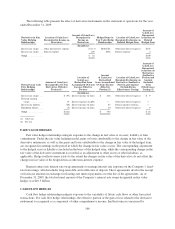
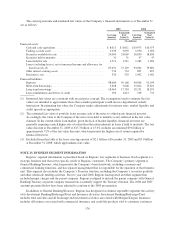
The following table presents the effect of derivative instruments on the statement of operations for the year
ended December 31, 2009:
Derivatives in Fair
Value Hedging
Relationships
Location of Gain(Loss)
Recognized in Income on
Derivatives
Amount of Gain(Loss)
Recognized in
Income on
Derivatives
Hedged Items in
Fair Value Hedge
Relationships
Location of Gain(Loss)
Recognized in Income on
Related Hedged Item
Amount of
Gain(Loss)
Recognized
in Income on
Related
Hedged Item
(In millions)
Interest rate swaps . . . Other non-interest expense $ (113) Debt/CDs Other non-interest expense $105
Interest rate swaps . . . Interest expense 169 Debt Interest expense 4
Total ............. $ 56 $109
Derivatives in Cash
Flow Hedging
Relationships
Amount of Gain(Loss)
Recognized in OCI on
Derivatives (Effective
Portion)(1)
Location of
Gain(Loss)
Reclassified from
Accumulated OCI into
Income (Effective
Portion)
Amount
of Gain(Loss)
Reclassified
from Accumulated
OCI into Income
(Effective
Portion)(2)
Location of Gain(Loss)
Recognized in Income on
Derivatives (Ineffective
Portion and Amount
Excluded from
Effectiveness Testing)
Amount of
Gain(Loss)
Recognized
in Income on
Derivatives
(Ineffective
Portion and
Amount
Excluded
from
Effectiveness
Testing)(2)
(In millions)
Interest rate swaps . . . $ (97) Interest income on loans $ 238 Other non-interest expense $ 9
Forward starting
swaps ........... 10 Interest expense on debt — Other non-interest expense —
Interest rate options . . (29) Interest income on loans 85 Interest income on loans —
Eurodollar futures . . . (5) Interest income on loans 30 Other non-interest expense 9
Total ............. $(121) $ 353 $ 18
(1) After-tax
(2) Pre-tax
FAIR VALUE HEDGES
Fair value hedge relationships mitigate exposure to the change in fair value of an asset, liability or firm
commitment. Under the fair value hedging model, gains or losses attributable to the change in fair value of the
derivative instrument, as well as the gains and losses attributable to the change in fair value of the hedged item,
are recognized in earnings in the period in which the change in fair value occurs. The corresponding adjustment
to the hedged asset or liability is included in the basis of the hedged item, while the corresponding change in the
fair value of the derivative instrument is recorded as an adjustment to other assets or other liabilities, as
applicable. Hedge ineffectiveness exists to the extent the changes in fair value of the derivative do not offset the
changes in fair value of the hedged item as other non-interest expense.
Regions enters into interest rate swap agreements to manage interest rate exposure on the Company’s fixed-
rate borrowings, which includes long-term debt and certificates of deposit. These agreements involve the receipt
of fixed-rate amounts in exchange for floating-rate interest payments over the life of the agreements. As of
December 31, 2009, the total notional amount of the Company’s interest rate swaps designated in fair value
hedges was $10.3 billion.
CASH FLOW HEDGES
Cash flow hedge relationships mitigate exposure to the variability of future cash flows or other forecasted
transactions. For cash flow hedge relationships, the effective portion of the gain or loss related to the derivative
instrument is recognized as a component of other comprehensive income. Ineffectiveness is measured by
166