Regions Bank 2009 Annual Report Download - page 58
Download and view the complete annual report
Please find page 58 of the 2009 Regions Bank annual report below. You can navigate through the pages in the report by either clicking on the pages listed below, or by using the keyword search tool below to find specific information within the annual report.-
 1
1 -
2
-
3
-
4
-
5
-
6
-
7
-
8
-
9
-
10
-
11
-
12
-
13
-
14
-
15
-
16
-
17
-
18
-
19
-
20
-
21
-
22
-
23
-
24
-
25
-
26
-
27
-
28
-
29
-
30
-
31
-
32
-
33
-
34
-
35
-
36
-
37
-
38
-
39
-
40
-
41
-
42
-
43
-
44
-
45
-
46
-
47
-
 48
48 -
 49
49 -
 50
50 -
 51
51 -
 52
52 -
 53
53 -
 54
54 -
 55
55 -
 56
56 -
 57
57 -
 58
58 -
 59
59 -
 60
60 -
 61
61 -
 62
62 -
 63
63 -
 64
64 -
 65
65 -
 66
66 -
 67
67 -
 68
68 -
69
-
70
-
71
-
72
-
73
-
74
-
75
-
76
-
77
-
78
-
79
-
80
-
81
-
82
-
83
-
84
-
85
-
86
-
87
-
88
-
89
-
90
-
91
-
92
-
93
-
94
-
95
-
96
-
97
-
98
-
99
-
100
-
101
-
102
-
103
-
104
-
105
-
106
-
107
-
108
-
109
-
110
-
111
-
112
-
113
-
114
-
115
-
116
-
117
-
118
-
119
-
120
-
121
-
122
-
123
-
124
-
125
-
126
-
127
-
128
-
129
-
130
-
131
-
132
-
133
-
134
-
135
-
136
-
137
-
138
-
139
-
140
-
141
-
142
-
143
-
144
-
145
-
146
-
147
-
148
-
149
-
150
-
151
-
152
-
153
-
154
-
155
-
156
-
157
-
158
-
159
-
160
-
161
-
162
-
163
-
164
-
165
-
166
-
167
-
168
-
169
-
170
-
171
-
172
-
173
-
174
-
175
-
176
-
177
-
178
-
179
-
180
-
181
-
182
-
183
-
184
-
185
-
186
-
187
-
188
-
189
-
190
-
191
-
192
-
193
-
194
-
195
-
196
-
197
-
198
-
199
-
200
-
201
-
202
-
203
-
204
-
205
-
206
-
207
-
208
-
209
-
210
-
211
-
212
-
213
-
214
-
215
-
216
-
217
-
218
-
219
-
220
 |
 |
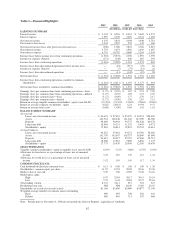
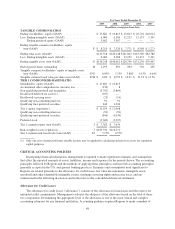
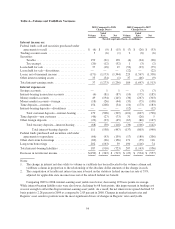
Non-interest income increased to $3.8 billion in 2009 from $3.1 billion in 2008. Non-interest income
excluding securities gains/losses totaled $3.7 billion or 52 percent of total revenue (fully taxable-equivalent
basis) in 2009 compared to $3.0 billion or 43 percent in 2008, and continued to reflect Regions’ diversified
revenue stream. The year over year increase was due primarily to several items impacting 2009 with no
corresponding impact on 2008. These items include gains from terminations of leveraged leases, which was
largely offset in income taxes, and a gain on extinguishment of debt realized in connection with the Company’s
issuance of common stock in exchange for trust preferred securities. Additionally, mortgage income was higher
during 2009 as compared to the previous year, reflecting increased loan origination activity spurred by a
favorable mortgage interest rate environment. Decreases in non-interest income attributable to brokerage,
investment banking and capital markets income and trust department income partially offset the increase for the
year. Morgan Keegan recorded net income of $90 million in 2009 as compared to $128 million in 2008.
Non-interest expense from continuing operations totaled $4.8 billion in 2009 compared to $10.8 billion in
2008, which was impacted significantly by a $6.0 billion non-cash goodwill impairment charge. Also reflected in
non-interest expenses were merger charges totaling $201 million in 2008 whereas none were recorded in 2009.
Merger costs consist mainly of personnel expenses, the cost of integrating AmSouth systems with those of
Regions and the consolidation of branches. Excluding the goodwill impairment and merger-related expenses,
non-interest expense increased $160 million or 3.5 percent in 2009 compared to 2008. The largest drivers were
increased professional and legal fees, higher other real estate owned expenses driven by losses related to the
continued decline in the housing market, and increased FDIC insurance premiums, including an FDIC special
assessment. Results for 2009 also reflected higher other-than-temporary impairment on securities, as well as
charges associated with the consolidation of 121 branches. The increases from 2008 to 2009 were partially offset
by a 2008 loss on the early extinguishment of debt related to the redemption of subordinated notes, an
impairment of mortgage servicing rights and write-downs on the investment in two Morgan Keegan mutual
funds. See Table 9 “Non-Interest Expense (including Non-GAAP Reconciliation)” for further details.
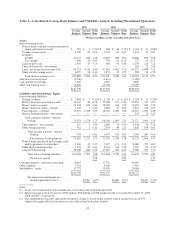
Total loans decreased by 6.9 percent in 2009, driven mainly by lower commercial and industrial loans, as
well as a decline in construction loans, reflecting developers’ reluctance to begin new projects or purchase
existing projects under current economic conditions. Also, a large portion of the Company’s indirect consumer
lending portfolio is in run-off mode, which was a catalyst to the lower outstanding balances for the assets.
Partially offsetting these decreases was an increase in the commercial real estate mortgage portfolio which was
attributable to the migration from construction loans as projects are completed. Deposits increased 8.6 percent in
2009 as compared to 2008, driven primarily by growth in non-interest-bearing demand deposits and domestic
money market balances. Partially offsetting was a decline in foreign money market funds and low certificate of
deposit balances.
On May 7, 2009, the final results of the Federal Reserve’s Supervisory Capital Assessment Program
(“SCAP”) were released requiring Regions to submit a capital plan to its regulators detailing the steps to be
utilized to increase total Tier 1 common by $2.5 billion, of which at least $0.4 billion had to be Tier 1 equity. In
the second quarter, Regions fulfilled the SCAP requirement primarily through the issuance of common and
preferred securities. The Company’s public equity offering of common stock, announced May 20, 2009, resulted
in the issuance of 460 million shares at $4 per share, generating proceeds of approximately $1.8 billion, net of
issuance costs. At the same date, the Company issued 287,500 shares of mandatorily convertible preferred stock,
Series B, generating net proceeds of $278 million. In addition to these offerings, the Company exchanged
approximately 33 million common shares for $202 million of outstanding 6.625% trust preferred securities
issued by an affiliated Trust. The Company also sold shares in Visa Inc. and other securities, which generated
additional capital. Further detail on these offerings is disclosed in the “Stockholders’ Equity” section of this
report.
Table 2 “GAAP to Non-GAAP Reconciliation” presents computations of earnings and certain other
financial measures excluding merger and goodwill impairment charges, including “average tangible common
stockholders’ equity”, end of period “tangible common stockholders’ equity” and “Tier 1 common equity”, all of
44