Regions Bank 2009 Annual Report Download - page 56
Download and view the complete annual report
Please find page 56 of the 2009 Regions Bank annual report below. You can navigate through the pages in the report by either clicking on the pages listed below, or by using the keyword search tool below to find specific information within the annual report.-
 1
1 -
2
-
3
-
4
-
5
-
6
-
7
-
8
-
9
-
10
-
11
-
12
-
13
-
14
-
15
-
16
-
17
-
18
-
19
-
20
-
21
-
22
-
23
-
24
-
25
-
26
-
27
-
28
-
29
-
30
-
31
-
32
-
33
-
34
-
35
-
36
-
37
-
38
-
39
-
40
-
41
-
42
-
43
-
44
-
45
-
 46
46 -
 47
47 -
 48
48 -
 49
49 -
 50
50 -
 51
51 -
 52
52 -
 53
53 -
 54
54 -
 55
55 -
 56
56 -
 57
57 -
 58
58 -
 59
59 -
 60
60 -
 61
61 -
 62
62 -
 63
63 -
 64
64 -
 65
65 -
 66
66 -
67
-
68
-
69
-
70
-
71
-
72
-
73
-
74
-
75
-
76
-
77
-
78
-
79
-
80
-
81
-
82
-
83
-
84
-
85
-
86
-
87
-
88
-
89
-
90
-
91
-
92
-
93
-
94
-
95
-
96
-
97
-
98
-
99
-
100
-
101
-
102
-
103
-
104
-
105
-
106
-
107
-
108
-
109
-
110
-
111
-
112
-
113
-
114
-
115
-
116
-
117
-
118
-
119
-
120
-
121
-
122
-
123
-
124
-
125
-
126
-
127
-
128
-
129
-
130
-
131
-
132
-
133
-
134
-
135
-
136
-
137
-
138
-
139
-
140
-
141
-
142
-
143
-
144
-
145
-
146
-
147
-
148
-
149
-
150
-
151
-
152
-
153
-
154
-
155
-
156
-
157
-
158
-
159
-
160
-
161
-
162
-
163
-
164
-
165
-
166
-
167
-
168
-
169
-
170
-
171
-
172
-
173
-
174
-
175
-
176
-
177
-
178
-
179
-
180
-
181
-
182
-
183
-
184
-
185
-
186
-
187
-
188
-
189
-
190
-
191
-
192
-
193
-
194
-
195
-
196
-
197
-
198
-
199
-
200
-
201
-
202
-
203
-
204
-
205
-
206
-
207
-
208
-
209
-
210
-
211
-
212
-
213
-
214
-
215
-
216
-
217
-
218
-
219
-
220
 |
 |

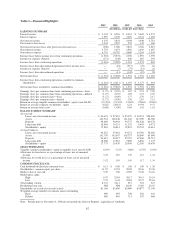
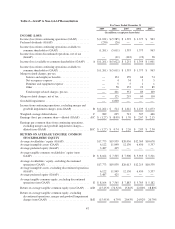
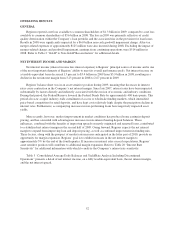
Table 1—Financial Highlights
2009 2008 2007 2006 2005
(In millions, except per share data)
EARNINGS SUMMARY
Interest income ................................................ $ 5,332 $ 6,563 $ 8,074 $ 5,649 $ 4,271
Interest expense ............................................... 1,997 2,720 3,676 2,341 1,490
Net interest income ............................................ 3,335 3,843 4,398 3,308 2,781
Provision for loan losses ........................................ 3,541 2,057 555 142 166
Net interest income (loss) after provision for loan losses ............... (206) 1,786 3,843 3,166 2,615
Non-interest income ............................................ 3,755 3,073 2,856 2,030 1,687
Non-interest expense ........................................... 4,751 10,792 4,660 3,204 2,943
Income (loss) before income taxes from continuing operations .......... (1,202) (5,933) 2,039 1,992 1,359
Income tax expense (benefit) ..................................... (171) (348) 646 619 396
Income (loss) from continuing operations ........................... (1,031) (5,585) 1,393 1,373 963
Income (loss) from discontinued operations before income taxes ........ — (18) (217) (32) 64
Income tax expense (benefit) ..................................... — (7) (75) (13) 26
Income (loss) from discontinued operations ......................... — (11) (142) (19) 38
Net income (loss) .............................................. $ (1,031) $ (5,596) $ 1,251 $ 1,354 $ 1,001
Income (loss) from continuing operations available to common
shareholders ................................................ $ (1,261) $ (5,611) $ 1,393 $ 1,373 $ 963
Net income (loss) available to common shareholders .................. $ (1,261) $ (5,622) $ 1,251 $ 1,354 $ 1,001
Earnings (loss) per common share from continuing operations—basic .... $ (1.27) $ (8.07) $ 1.97 $ 2.74 $ 2.09
Earnings (loss) per common share from continuing operations—diluted . . . (1.27) (8.07) 1.95 2.71 2.07
Earnings (loss) per common share—basic .......................... (1.27) (8.09) 1.77 2.70 2.17
Earnings (loss) per common share—diluted ......................... (1.27) (8.09) 1.76 2.67 2.15
Return on average tangible common stockholders’ equity (non-GAAP) . . . (15.45)% (74.32)% 15.82% 22.86% 18.80%
Return on average common stockholders’ equity ..................... (8.82) (28.81) 6.24 10.94 9.37
Return on average total assets .................................... (0.88) (3.90) 0.90 1.41 1.18
BALANCE SHEET SUMMARY
At year-end
Loans, net of unearned income ............................... $ 90,674 $ 97,419 $ 95,379 $ 94,551 $58,405
Assets ................................................... 142,318 146,248 141,042 143,369 84,786
Deposits ................................................. 98,680 90,904 94,775 101,228 60,378
Long-term debt ........................................... 18,464 19,231 11,325 8,643 6,972
Stockholders’ equity ....................................... 17,881 16,813 19,823 20,701 10,614
Average balances
Loans, net of unearned income ............................... 94,523 97,601 94,372 64,766 58,002
Assets ................................................... 142,759 143,947 138,757 95,800 85,096
Deposits ................................................. 94,612 90,077 95,725 67,466 59,713
Long-term debt ........................................... 18,588 13,510 9,698 6,856 7,175
Stockholders’ equity ....................................... 17,773 19,939 20,036 12,369 10,678
SELECTED RATIOS
Tangible common stockholders’ equity to tangible assets (non-GAAP) . . . 6.03% 5.23% 5.88% 6.53% 6.64%
Allowance for loan losses as a percentage of loans, net of unearned
income .................................................... 3.43 1.87 1.39 1.12 1.34
Allowance for credit losses as a percentage of loans, net of unearned
income .................................................... 3.52 1.95 1.45 1.17 1.34
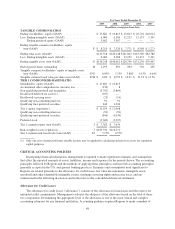
COMMON STOCK DATA
Cash dividends declared per common share ......................... $ 0.13 $ 0.96 $ 1.46 $ 1.40 $ 1.36
Stockholders’ common equity per share ............................ 11.97 19.53 28.58 28.36 23.26
Market value at year end ........................................ 5.29 7.96 23.65 37.40 34.16
Market price range:
High .................................................... 9.07 25.84 38.17 39.15 35.54
Low .................................................... 2.35 6.41 22.84 32.37 29.16
Total trading volume ........................................... 8,747 3,411 912 301 227
Dividend payout ratio .......................................... NM NM 82.49 51.85 62.67
Shareholders of record at year-end (actual) .......................... 81,166 83,600 85,060 84,877 72,140
Weighted-average number of common shares outstanding
Basic ................................................... 989 695 708 502 461
Diluted .................................................. 989 695 713 507 466
Note: Periods prior to November 4, 2006 do not include the effect of Regions’ acquisition of AmSouth.
42