Regions Bank 2009 Annual Report Download - page 80
Download and view the complete annual report
Please find page 80 of the 2009 Regions Bank annual report below. You can navigate through the pages in the report by either clicking on the pages listed below, or by using the keyword search tool below to find specific information within the annual report.-
 1
1 -
2
-
3
-
4
-
5
-
6
-
7
-
8
-
9
-
10
-
11
-
12
-
13
-
14
-
15
-
16
-
17
-
18
-
19
-
20
-
21
-
22
-
23
-
24
-
25
-
26
-
27
-
28
-
29
-
30
-
31
-
32
-
33
-
34
-
35
-
36
-
37
-
38
-
39
-
40
-
41
-
42
-
43
-
44
-
45
-
46
-
47
-
48
-
49
-
50
-
51
-
52
-
53
-
54
-
55
-
56
-
57
-
58
-
59
-
60
-
61
-
62
-
63
-
64
-
65
-
66
-
67
-
68
-
69
-
 70
70 -
 71
71 -
 72
72 -
 73
73 -
 74
74 -
 75
75 -
 76
76 -
 77
77 -
 78
78 -
 79
79 -
 80
80 -
 81
81 -
 82
82 -
 83
83 -
 84
84 -
 85
85 -
 86
86 -
 87
87 -
 88
88 -
 89
89 -
 90
90 -
91
-
92
-
93
-
94
-
95
-
96
-
97
-
98
-
99
-
100
-
101
-
102
-
103
-
104
-
105
-
106
-
107
-
108
-
109
-
110
-
111
-
112
-
113
-
114
-
115
-
116
-
117
-
118
-
119
-
120
-
121
-
122
-
123
-
124
-
125
-
126
-
127
-
128
-
129
-
130
-
131
-
132
-
133
-
134
-
135
-
136
-
137
-
138
-
139
-
140
-
141
-
142
-
143
-
144
-
145
-
146
-
147
-
148
-
149
-
150
-
151
-
152
-
153
-
154
-
155
-
156
-
157
-
158
-
159
-
160
-
161
-
162
-
163
-
164
-
165
-
166
-
167
-
168
-
169
-
170
-
171
-
172
-
173
-
174
-
175
-
176
-
177
-
178
-
179
-
180
-
181
-
182
-
183
-
184
-
185
-
186
-
187
-
188
-
189
-
190
-
191
-
192
-
193
-
194
-
195
-
196
-
197
-
198
-
199
-
200
-
201
-
202
-
203
-
204
-
205
-
206
-
207
-
208
-
209
-
210
-
211
-
212
-
213
-
214
-
215
-
216
-
217
-
218
-
219
-
220
 |
 |

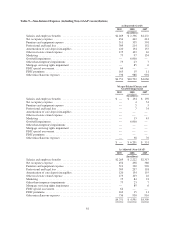
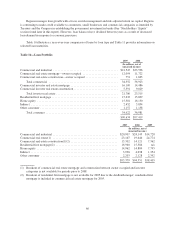
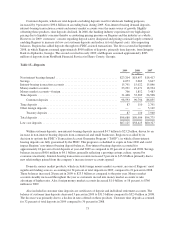
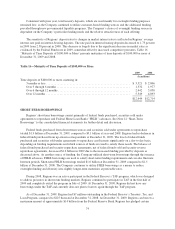
Regions manages loan growth with a focus on risk management and risk adjusted return on capital. Regions
is continuing to make credit available to consumers, small businesses and commercial companies as intended by
Treasury and the Congress in establishing the government investment in banks (See “Stockholders’ Equity”
section found later in this report). However, loan balances have declined between years as a result of decreased
loan demand in response to economic pressures.
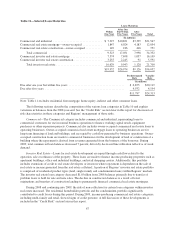
Table 10 illustrates a year-over-year comparison of loans by loan type and Table 11 provides information on
selected loan maturities.
Table 10—Loan Portfolio
2009 2008
(In millions, net of
unearned income)
Commercial and industrial ............................................ $21,547 $23,596
Commercial real estate mortgage—owner occupied ........................ 12,054 11,722
Commercial real estate construction—owner occupied ...................... 751 1,605
Total commercial ............................................... 34,352 36,923
Commercial investor real estate mortgage ................................ 16,109 14,486
Commercial investor real estate construction .............................. 5,591 9,029
Total investor real estate .......................................... 21,700 23,515
Residential first mortgage ............................................. 15,632 15,839
Home equity ....................................................... 15,381 16,130
Indirect ........................................................... 2,452 3,854
Other consumer ..................................................... 1,157 1,158
Total consumer ................................................. 34,622 36,981
$90,674 $97,419
2007 2006 2005
(In millions, net of
unearned income)
Commercial and industrial ............................................ $20,907 $24,145 $14,728
Commercial real estate(1) ............................................ 23,107 19,646 24,774
Commercial real estate construction(1)(2) ................................ 13,302 14,121 7,362
Residential first mortgage(2) .......................................... 16,960 15,584 n/a
Home equity ....................................................... 14,962 14,889 7,795
Indirect ........................................................... 3,938 4,038 1,354
Other consumer .................................................... 2,203 2,128 2,392
$95,379 $94,551 $58,405
(1) Breakout of commercial real estate mortgage and construction between owner occupied and investor
categories is not available for periods prior to 2008.
(2) Breakout of residential first mortgage is not available for 2005 due to the AmSouth merger; residential first
mortgage is included in commercial real estate mortgage for 2005.
66