Regions Bank 2009 Annual Report Download - page 191
Download and view the complete annual report
Please find page 191 of the 2009 Regions Bank annual report below. You can navigate through the pages in the report by either clicking on the pages listed below, or by using the keyword search tool below to find specific information within the annual report.-
 1
1 -
2
-
3
-
4
-
5
-
6
-
7
-
8
-
9
-
10
-
11
-
12
-
13
-
14
-
15
-
16
-
17
-
18
-
19
-
20
-
21
-
22
-
23
-
24
-
25
-
26
-
27
-
28
-
29
-
30
-
31
-
32
-
33
-
34
-
35
-
36
-
37
-
38
-
39
-
40
-
41
-
42
-
43
-
44
-
45
-
46
-
47
-
48
-
49
-
50
-
51
-
52
-
53
-
54
-
55
-
56
-
57
-
58
-
59
-
60
-
61
-
62
-
63
-
64
-
65
-
66
-
67
-
68
-
69
-
70
-
71
-
72
-
73
-
74
-
75
-
76
-
77
-
78
-
79
-
80
-
81
-
82
-
83
-
84
-
85
-
86
-
87
-
88
-
89
-
90
-
91
-
92
-
93
-
94
-
95
-
96
-
97
-
98
-
99
-
100
-
101
-
102
-
103
-
104
-
105
-
106
-
107
-
108
-
109
-
110
-
111
-
112
-
113
-
114
-
115
-
116
-
117
-
118
-
119
-
120
-
121
-
122
-
123
-
124
-
125
-
126
-
127
-
128
-
129
-
130
-
131
-
132
-
133
-
134
-
135
-
136
-
137
-
138
-
139
-
140
-
141
-
142
-
143
-
144
-
145
-
146
-
147
-
148
-
149
-
150
-
151
-
152
-
153
-
154
-
155
-
156
-
157
-
158
-
159
-
160
-
161
-
162
-
163
-
164
-
165
-
166
-
167
-
168
-
169
-
170
-
171
-
172
-
173
-
174
-
175
-
176
-
177
-
178
-
179
-
180
-
 181
181 -
 182
182 -
 183
183 -
 184
184 -
 185
185 -
 186
186 -
 187
187 -
 188
188 -
 189
189 -
 190
190 -
 191
191 -
 192
192 -
 193
193 -
 194
194 -
 195
195 -
 196
196 -
 197
197 -
 198
198 -
 199
199 -
 200
200 -
 201
201 -
202
-
203
-
204
-
205
-
206
-
207
-
208
-
209
-
210
-
211
-
212
-
213
-
214
-
215
-
216
-
217
-
218
-
219
-
220
 |
 |

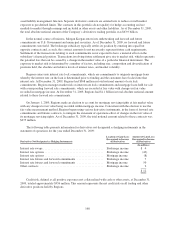
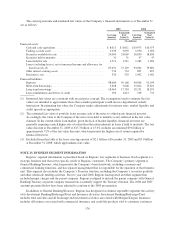
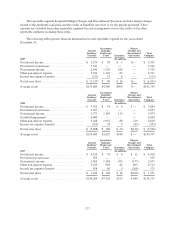
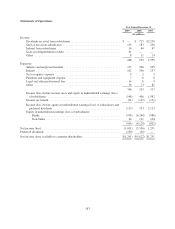
The reportable segment designated Merger Charges and Discontinued Operations includes merger charges
related to the AmSouth acquisition and the results of EquiFirst (see Note 3) for the periods presented. These
amounts are excluded from other reportable segments because management reviews the results of the other
reportable segments excluding these items.
The following tables present financial information for each reportable segment for the years ended
December 31:
General
Banking/
Treasury
Investment
Banking/
Brokerage/
Trust Insurance
Merger
Charges and
Discontinued
Operations
Total
Company
2009 (In millions)
Net interest income ........................... $ 3,274 $ 58 $ 3 $— $ 3,335
Provision for loan losses ....................... 3,541 — — — 3,541
Non-interest income .......................... 2,440 1,207 108 — 3,755
Other non-interest expense ..................... 3,542 1,122 87 — 4,751
Income tax expense (benefit) ................... (232) 53 8 — (171)
Net income (loss) ............................ $ (1,137) $ 90 $ 16 $— $ (1,031)
Average assets .............................. $137,683 $4,586 $490 $— $142,759
General
Banking/
Treasury
Investment
Banking/
Brokerage/
Trust Insurance
Merger
Charges and
Discontinued
Operations
Total
Company
2008 (In millions)
Net interest income ........................... $ 3,765 $ 74 $ 4 $ — $ 3,843
Provision for loan losses ....................... 2,057 — — — 2,057
Non-interest income .......................... 1,777 1,183 113 — 3,073
Goodwill impairment ......................... 6,000 — — — 6,000
Other non-interest expense ..................... 3,448 1,055 88 219 4,810
Income tax expense (benefit) ................... (355) 74 9 (83) (355)
Net income (loss) ............................ $ (5,608) $ 128 $ 20 $(136) $ (5,596)
Average assets .............................. $139,984 $3,623 $340 $ — $143,947
General
Banking/
Treasury
Investment
Banking/
Brokerage/
Trust Insurance
Merger
Charges and
Discontinued
Operations
Total
Company
2007 (In millions)
Net interest income ........................... $ 4,314 $ 78 $ 6 $ 12 $ 4,410
Provision for loan losses ....................... 555 — — — 555
Non-interest income .......................... 1,569 1,184 103 (177) 2,679
Other non-interest expense ..................... 3,229 998 82 403 4,712
Income tax expense (benefit) ................... 674 96 9 (208) 571
Net income (loss) ............................ $ 1,425 $ 168 $ 18 $(360) $ 1,251
Average assets .............................. $134,284 $3,718 $275 $ 480 $138,757
177