Regions Bank 2009 Annual Report Download - page 117
Download and view the complete annual report
Please find page 117 of the 2009 Regions Bank annual report below. You can navigate through the pages in the report by either clicking on the pages listed below, or by using the keyword search tool below to find specific information within the annual report.-
 1
1 -
2
-
3
-
4
-
5
-
6
-
7
-
8
-
9
-
10
-
11
-
12
-
13
-
14
-
15
-
16
-
17
-
18
-
19
-
20
-
21
-
22
-
23
-
24
-
25
-
26
-
27
-
28
-
29
-
30
-
31
-
32
-
33
-
34
-
35
-
36
-
37
-
38
-
39
-
40
-
41
-
42
-
43
-
44
-
45
-
46
-
47
-
48
-
49
-
50
-
51
-
52
-
53
-
54
-
55
-
56
-
57
-
58
-
59
-
60
-
61
-
62
-
63
-
64
-
65
-
66
-
67
-
68
-
69
-
70
-
71
-
72
-
73
-
74
-
75
-
76
-
77
-
78
-
79
-
80
-
81
-
82
-
83
-
84
-
85
-
86
-
87
-
88
-
89
-
90
-
91
-
92
-
93
-
94
-
95
-
96
-
97
-
98
-
99
-
100
-
101
-
102
-
103
-
104
-
105
-
106
-
 107
107 -
 108
108 -
 109
109 -
 110
110 -
 111
111 -
 112
112 -
 113
113 -
 114
114 -
 115
115 -
 116
116 -
 117
117 -
 118
118 -
 119
119 -
 120
120 -
 121
121 -
 122
122 -
 123
123 -
 124
124 -
 125
125 -
 126
126 -
 127
127 -
128
-
129
-
130
-
131
-
132
-
133
-
134
-
135
-
136
-
137
-
138
-
139
-
140
-
141
-
142
-
143
-
144
-
145
-
146
-
147
-
148
-
149
-
150
-
151
-
152
-
153
-
154
-
155
-
156
-
157
-
158
-
159
-
160
-
161
-
162
-
163
-
164
-
165
-
166
-
167
-
168
-
169
-
170
-
171
-
172
-
173
-
174
-
175
-
176
-
177
-
178
-
179
-
180
-
181
-
182
-
183
-
184
-
185
-
186
-
187
-
188
-
189
-
190
-
191
-
192
-
193
-
194
-
195
-
196
-
197
-
198
-
199
-
200
-
201
-
202
-
203
-
204
-
205
-
206
-
207
-
208
-
209
-
210
-
211
-
212
-
213
-
214
-
215
-
216
-
217
-
218
-
219
-
220
 |
 |

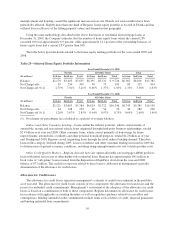
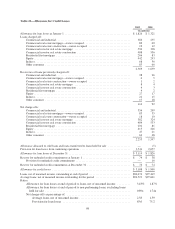
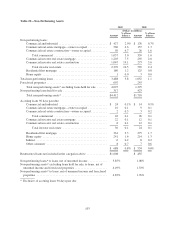
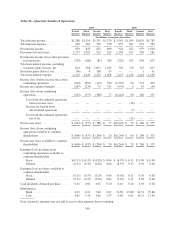
Table 29—Non-Performing Assets
2009 2008
(Dollars in millions)
Amount
% of loan
balance Amount
% of loan
balance
Non-performing loans:
Commercial and industrial ................................. $ 427 2.0% $ 176 0.7%
Commercial real estate mortgage—owner occupied ............. 560 4.6 157 1.3
Commercial real estate construction—owner occupied ........... 50 6.7 26 1.6
Total commercial .................................... 1,037 3.0 359 1.0
Commercial investor real estate mortgage ..................... 1,203 7.5 292 2.0
Commercial investor real estate construction .................. 1,067 19.1 273 3.0
Total investor real estate .............................. 2,270 10.5 565 2.4
Residential first mortgage ................................. 180 1.2 125 0.8
Home equity ............................................ 1 0.0 3 0.0
Total non-performing loans .................................... 3,488 3.8 1,052 1.1
Foreclosed properties ......................................... 607 243
Total non-performing assets* excluding loans held for sale ....... 4,095 1,295
Non-performing loans held for sale .............................. 317 423
Total non-performing assets* ............................... $4,412 $1,718
Accruing loans 90 days past due:
Commercial and industrial ................................. $ 24 0.1% $ 14 0.1%
Commercial real estate mortgage—owner occupied ............. 16 0.1 9 0.1
Commercial real estate construction—owner occupied ........... 2 0.3 3 0.2
Total commercial .................................... 42 0.1 26 0.1
Commercial investor real estate mortgage ..................... 22 0.1 12 0.1
Commercial investor real estate construction .................. 8 0.1 12 0.1
Total investor real estate .............................. 30 0.1 24 0.1
Residential first mortgage ................................. 361 2.3 275 1.7
Home equity ............................................ 241 1.6 214 1.3
Indirect ................................................ 6 0.2 8 0.2
Other consumer ......................................... 8 0.7 7 0.6
$ 688 0.8% $ 554 0.6%
Restructured loans not included in the categories above .............. $1,608 $ 455
Non-performing loans* to loans, net of unearned income ............. 3.85% 1.08%
Non-performing assets* excluding loans held for sale, to loans, net of
unearned income and foreclosed properties ...................... 4.49% 1.33%
Non-performing assets* to loans, net of unearned income and foreclosed
properties ................................................ 4.83% 1.76%
* Exclusive of accruing loans 90 days past due
103