Regions Bank 2009 Annual Report Download - page 62
Download and view the complete annual report
Please find page 62 of the 2009 Regions Bank annual report below. You can navigate through the pages in the report by either clicking on the pages listed below, or by using the keyword search tool below to find specific information within the annual report.-
 1
1 -
2
-
3
-
4
-
5
-
6
-
7
-
8
-
9
-
10
-
11
-
12
-
13
-
14
-
15
-
16
-
17
-
18
-
19
-
20
-
21
-
22
-
23
-
24
-
25
-
26
-
27
-
28
-
29
-
30
-
31
-
32
-
33
-
34
-
35
-
36
-
37
-
38
-
39
-
40
-
41
-
42
-
43
-
44
-
45
-
46
-
47
-
48
-
49
-
50
-
51
-
 52
52 -
 53
53 -
 54
54 -
 55
55 -
 56
56 -
 57
57 -
 58
58 -
 59
59 -
 60
60 -
 61
61 -
 62
62 -
 63
63 -
 64
64 -
 65
65 -
 66
66 -
 67
67 -
 68
68 -
 69
69 -
 70
70 -
 71
71 -
 72
72 -
73
-
74
-
75
-
76
-
77
-
78
-
79
-
80
-
81
-
82
-
83
-
84
-
85
-
86
-
87
-
88
-
89
-
90
-
91
-
92
-
93
-
94
-
95
-
96
-
97
-
98
-
99
-
100
-
101
-
102
-
103
-
104
-
105
-
106
-
107
-
108
-
109
-
110
-
111
-
112
-
113
-
114
-
115
-
116
-
117
-
118
-
119
-
120
-
121
-
122
-
123
-
124
-
125
-
126
-
127
-
128
-
129
-
130
-
131
-
132
-
133
-
134
-
135
-
136
-
137
-
138
-
139
-
140
-
141
-
142
-
143
-
144
-
145
-
146
-
147
-
148
-
149
-
150
-
151
-
152
-
153
-
154
-
155
-
156
-
157
-
158
-
159
-
160
-
161
-
162
-
163
-
164
-
165
-
166
-
167
-
168
-
169
-
170
-
171
-
172
-
173
-
174
-
175
-
176
-
177
-
178
-
179
-
180
-
181
-
182
-
183
-
184
-
185
-
186
-
187
-
188
-
189
-
190
-
191
-
192
-
193
-
194
-
195
-
196
-
197
-
198
-
199
-
200
-
201
-
202
-
203
-
204
-
205
-
206
-
207
-
208
-
209
-
210
-
211
-
212
-
213
-
214
-
215
-
216
-
217
-
218
-
219
-
220
 |
 |

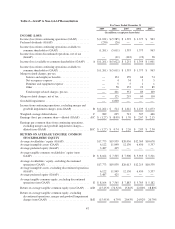
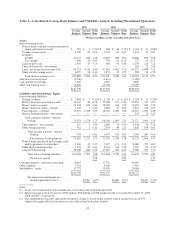
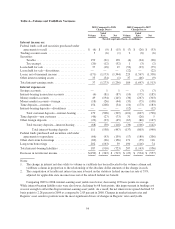
For Years Ended December 31
2009 2008 2007 2006 2005
(In millions, except per share data)
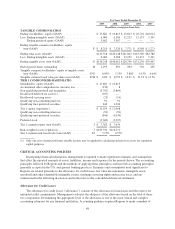
TANGIBLE COMMON RATIOS
Ending stockholders’ equity (GAAP) ................... $ 17,881 $ 16,813 $ 19,823 $ 20,701 $10,614
Less: Ending intangible assets (GAAP) ................. 6,060 6,186 12,252 12,133 5,341
Ending preferred equity (GAAP) ................. 3,602 3,307 — — —
Ending tangible common stockholders’ equity
(non-GAAP) .................................... F $ 8,219 $ 7,320 $ 7,571 $ 8,568 $ 5,273
Ending total assets (GAAP) .......................... $142,318 $146,248 $141,042 $143,369 $84,786
Less: Ending intangible assets (GAAP) ................. 6,060 6,186 12,252 12,133 5,341
Ending tangible assets (non-GAAP) .................... G $136,258 $140,062 $128,790 $131,236 $79,445
End of period shares outstanding ...................... H 1,193 691 694 730 456
Tangible common stockholders’ equity to tangible assets
(non-GAAP) .................................... F/G 6.03% 5.23% 5.88% 6.53% 6.64%
Tangible common book value per share (non-GAAP) ...... F/H $ 6.89 $ 10.59 $ 10.91 $ 11.74 $ 11.56
TIER 1 COMMON RISK-BASED RATIO
Stockholders’ equity (GAAP) ......................... $ 17,881 $ 16,813
Accumulated other comprehensive (income) loss ......... (130) 8
Non-qualifying goodwill and intangibles ................ (5,792) (5,864)
Disallowed deferred tax assets(1) ...................... (947) —
Disallowed servicing assets .......................... (25) (16)
Qualifying non-controlling interests .................... 91 91
Qualifying trust preferred securities .................... 846 1,036
Tier 1 capital (regulatory) ............................ $ 11,924 $ 12,068
Qualifying non-controlling interests .................... (91) (91)
Qualifying trust preferred securities .................... (846) (1,036)
Preferred stock .................................... (3,602) (3,307)
Tier 1 common equity (non-GAAP) .................... I $ 7,385 $ 7,634
Risk-weighted assets (regulatory) ...................... J $103,330 $116,251
Tier 1 common risk-based ratio (non-GAAP) ............ I/J 7.15% 6.57%
(1) Only one year of projected future taxable income may be applied in calculating deferred tax assets for regulatory
capital purposes.
CRITICAL ACCOUNTING POLICIES
In preparing financial information, management is required to make significant estimates and assumptions
that affect the reported amounts of assets, liabilities, income and expenses for the periods shown. The accounting
principles followed by Regions and the methods of applying these principles conform with accounting principles
generally accepted in the U.S. and general banking practices. Estimates and assumptions most significant to
Regions are related primarily to the allowance for credit losses, fair value measurements, intangible assets
(goodwill and other identifiable intangible assets), mortgage servicing rights and income taxes, and are
summarized in the following discussion and in the notes to the consolidated financial statements.
Allowance for Credit Losses
The allowance for credit losses (“allowance”) consists of the allowance for loan losses and the reserve for
unfunded credit commitments. Management evaluates the adequacy of the allowance based on the total of these
two components. Determining the appropriate level of the allowance is one of the most critical and complex
accounting estimates for any financial institution. Accounting guidance requires Regions to make a number of
48