Regions Bank 2009 Annual Report Download - page 128
Download and view the complete annual report
Please find page 128 of the 2009 Regions Bank annual report below. You can navigate through the pages in the report by either clicking on the pages listed below, or by using the keyword search tool below to find specific information within the annual report.-
 1
1 -
2
-
3
-
4
-
5
-
6
-
7
-
8
-
9
-
10
-
11
-
12
-
13
-
14
-
15
-
16
-
17
-
18
-
19
-
20
-
21
-
22
-
23
-
24
-
25
-
26
-
27
-
28
-
29
-
30
-
31
-
32
-
33
-
34
-
35
-
36
-
37
-
38
-
39
-
40
-
41
-
42
-
43
-
44
-
45
-
46
-
47
-
48
-
49
-
50
-
51
-
52
-
53
-
54
-
55
-
56
-
57
-
58
-
59
-
60
-
61
-
62
-
63
-
64
-
65
-
66
-
67
-
68
-
69
-
70
-
71
-
72
-
73
-
74
-
75
-
76
-
77
-
78
-
79
-
80
-
81
-
82
-
83
-
84
-
85
-
86
-
87
-
88
-
89
-
90
-
91
-
92
-
93
-
94
-
95
-
96
-
97
-
98
-
99
-
100
-
101
-
102
-
103
-
104
-
105
-
106
-
107
-
108
-
109
-
110
-
111
-
112
-
113
-
114
-
115
-
116
-
117
-
 118
118 -
 119
119 -
 120
120 -
 121
121 -
 122
122 -
 123
123 -
 124
124 -
 125
125 -
 126
126 -
 127
127 -
 128
128 -
 129
129 -
 130
130 -
 131
131 -
 132
132 -
 133
133 -
 134
134 -
 135
135 -
 136
136 -
 137
137 -
 138
138 -
139
-
140
-
141
-
142
-
143
-
144
-
145
-
146
-
147
-
148
-
149
-
150
-
151
-
152
-
153
-
154
-
155
-
156
-
157
-
158
-
159
-
160
-
161
-
162
-
163
-
164
-
165
-
166
-
167
-
168
-
169
-
170
-
171
-
172
-
173
-
174
-
175
-
176
-
177
-
178
-
179
-
180
-
181
-
182
-
183
-
184
-
185
-
186
-
187
-
188
-
189
-
190
-
191
-
192
-
193
-
194
-
195
-
196
-
197
-
198
-
199
-
200
-
201
-
202
-
203
-
204
-
205
-
206
-
207
-
208
-
209
-
210
-
211
-
212
-
213
-
214
-
215
-
216
-
217
-
218
-
219
-
220
 |
 |

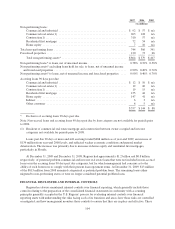
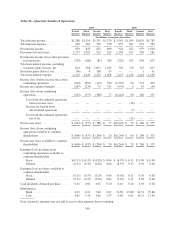
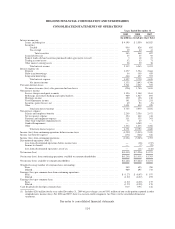
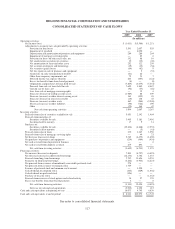
REGIONS FINANCIAL CORPORATION AND SUBSIDIARIES
CONSOLIDATED STATEMENTS OF OPERATIONS
Years Ended December 31
2009 2008 2007
(In millions, except per share data)
Interest income on:
Loans, including fees ............................................................. $4,199 $ 5,550 $6,925
Securities:
Taxable .................................................................... 966 828 856
Tax-exempt ................................................................ 19 40 41
Total securities .......................................................... 985 868 897
Loans held for sale ............................................................... 55 35 92
Federal funds sold and securities purchased under agreements to resell ...................... 3 18 51
Trading account assets ............................................................ 62 63 71
Other interest-earning assets ....................................................... 28 29 38
Total interest income ......................................................... 5,332 6,563 8,074
Interest expense on:
Deposits ....................................................................... 1,277 1,724 2,664
Short-term borrowings ............................................................ 54 369 459
Long-term borrowings ............................................................ 666 627 553
Total interest expense ......................................................... 1,997 2,720 3,676
Net interest income .......................................................... 3,335 3,843 4,398
Provision for loan losses .............................................................. 3,541 2,057 555
Net interest income (loss) after provision for loan losses ................................. (206) 1,786 3,843
Non-interest income:
Service charges on deposit accounts ................................................. 1,156 1,148 1,163
Brokerage, investment banking and capital markets ..................................... 989 1,027 895
Mortgage income ................................................................ 259 138 136
Trust department income .......................................................... 191 234 251
Securities gains (losses), net ....................................................... 69 92 (9)
Other ......................................................................... 1,091 434 420
Total non-interest income ..................................................... 3,755 3,073 2,856
Non-interest expense:
Salaries and employee benefits ..................................................... 2,269 2,356 2,472
Net occupancy expense ........................................................... 454 442 414
Furniture and equipment expense ................................................... 311 335 301
Other-than-temporary impairments(1) ................................................ 75 23 7
Goodwill impairment ............................................................. — 6,000 —
Other ......................................................................... 1,642 1,636 1,466
Total non-interest expense ..................................................... 4,751 10,792 4,660
Income (loss) from continuing operations before income taxes ................................ (1,202) (5,933) 2,039
Income tax (benefit) expense ........................................................... (171) (348) 646
Income (loss) from continuing operations ................................................. (1,031) (5,585) 1,393
Discontinued operations (Note 3):
Loss from discontinued operations before income taxes .................................. — (18) (217)
Income tax benefit ............................................................... — (7) (75)
Loss from discontinued operations, net of tax .......................................... — (11) (142)
Net income (loss) .................................................................... $(1,031) $ (5,596) $1,251
Net income (loss) from continuing operations available to common shareholders .................. $(1,261) $ (5,611) $1,393
Net income (loss) available to common shareholders ........................................ $(1,261) $ (5,622) $1,251
Weighted-average number of common shares outstanding:
Basic .......................................................................... 989 695 708
Diluted ........................................................................ 989 695 713
Earnings (loss) per common share from continuing operations:
Basic .......................................................................... $ (1.27) $ (8.07) $ 1.97
Diluted ........................................................................ (1.27) (8.07) 1.95
Earnings (loss) per common share:
Basic .......................................................................... (1.27) (8.09) 1.77
Diluted ........................................................................ (1.27) (8.09) 1.76
Cash dividends declared per common share 0.13 0.96 1.46
(1) Includes $266 million for the year ended December 31, 2009 of gross charges, net of $191 million of non-credit portion reported in other
comprehensive income (loss). For 2008 and 2007, there was no non-credit component. See Note 4 to the consolidated financial
statements.
See notes to consolidated financial statements.
114