Regions Bank 2009 Annual Report Download - page 147
Download and view the complete annual report
Please find page 147 of the 2009 Regions Bank annual report below. You can navigate through the pages in the report by either clicking on the pages listed below, or by using the keyword search tool below to find specific information within the annual report.-
 1
1 -
2
-
3
-
4
-
5
-
6
-
7
-
8
-
9
-
10
-
11
-
12
-
13
-
14
-
15
-
16
-
17
-
18
-
19
-
20
-
21
-
22
-
23
-
24
-
25
-
26
-
27
-
28
-
29
-
30
-
31
-
32
-
33
-
34
-
35
-
36
-
37
-
38
-
39
-
40
-
41
-
42
-
43
-
44
-
45
-
46
-
47
-
48
-
49
-
50
-
51
-
52
-
53
-
54
-
55
-
56
-
57
-
58
-
59
-
60
-
61
-
62
-
63
-
64
-
65
-
66
-
67
-
68
-
69
-
70
-
71
-
72
-
73
-
74
-
75
-
76
-
77
-
78
-
79
-
80
-
81
-
82
-
83
-
84
-
85
-
86
-
87
-
88
-
89
-
90
-
91
-
92
-
93
-
94
-
95
-
96
-
97
-
98
-
99
-
100
-
101
-
102
-
103
-
104
-
105
-
106
-
107
-
108
-
109
-
110
-
111
-
112
-
113
-
114
-
115
-
116
-
117
-
118
-
119
-
120
-
121
-
122
-
123
-
124
-
125
-
126
-
127
-
128
-
129
-
130
-
131
-
132
-
133
-
134
-
135
-
136
-
 137
137 -
 138
138 -
 139
139 -
 140
140 -
 141
141 -
 142
142 -
 143
143 -
 144
144 -
 145
145 -
 146
146 -
 147
147 -
 148
148 -
 149
149 -
 150
150 -
 151
151 -
 152
152 -
 153
153 -
 154
154 -
 155
155 -
 156
156 -
 157
157 -
158
-
159
-
160
-
161
-
162
-
163
-
164
-
165
-
166
-
167
-
168
-
169
-
170
-
171
-
172
-
173
-
174
-
175
-
176
-
177
-
178
-
179
-
180
-
181
-
182
-
183
-
184
-
185
-
186
-
187
-
188
-
189
-
190
-
191
-
192
-
193
-
194
-
195
-
196
-
197
-
198
-
199
-
200
-
201
-
202
-
203
-
204
-
205
-
206
-
207
-
208
-
209
-
210
-
211
-
212
-
213
-
214
-
215
-
216
-
217
-
218
-
219
-
220
 |
 |

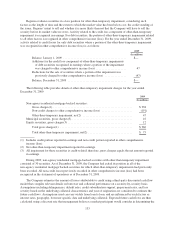
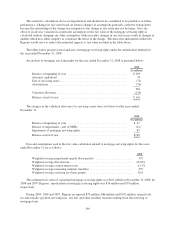
Regions evaluates securities in a loss position for other-than-temporary impairment, considering such
factors as the length of time and the extent to which the market value has been below cost, the credit standing of
the issuer, Regions’ intent to sell and whether it is more likely than not that the Company will have to sell the
security before its market value recovers. Activity related to the credit loss component of other-than-temporary
impairment is recognized in earnings. For debt securities, the portion of other-than-temporary impairment related
to all other factors is recognized in other comprehensive income (loss). For the year ended December 31, 2009,
activity related to credit losses for only debt securities where a portion of the other-than-temporary impairment
was recognized in other comprehensive income (loss) is as follows:
2009
(In millions)
Balance, January 1, 2009 ........................................... $—
Additions for the credit loss component of other-than-temporary impairments
of debt securities recognized in earnings where a portion of the impairment
was charged to other comprehensive income (loss) ..................... 47
Reductions for the sale of securities where a portion of the impairment was
previously charged to other comprehensive income (loss) ............... (47)
Balance, December 31, 2009 ........................................ $—
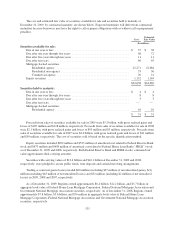
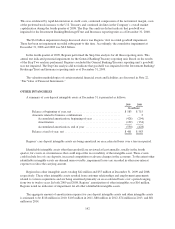
The following table provides details of other-than-temporary impairment charges for the year ended
December 31, 2009:
2009
(In millions)
Non-agency residential mortgage-backed securities:
Gross charges(1) ...................................................... $238
Non-credit charges to other comprehensive income (loss) ..................... (191)
Other-than-temporary impairment, net(2) .................................. 47
Municipal securities, gross charges(3) ......................................... 16
Equity securities, gross charges(3) ............................................ 12
Total gross charges(1) ................................................. $266
Total other-than-temporary impairment, net(2) .............................. $ 75
(1) Includes credit portion reported in earnings and non-credit portion reported in other comprehensive
income (loss).
(2) Net other-than-temporary impairment reported in earnings.
(3) All impairment for these securities is credit-related; therefore, gross charges equals the net amount reported
in earnings.
During 2009, non-agency residential mortgage-backed securities with other-than-temporary impairment
consisted of 30 securities. As of December 31, 2009, the Company had exited its position in all of the
non-agency residential mortgage backed securities for which other-than-temporary impairments had previously
been recorded. All non-credit losses previously recorded in other comprehensive income (loss) had been
recognized in the statement of operations as of December 31, 2009.
The Company estimates the amount of losses attributable to credit using a third-party discounted cash flow
model that compiles relevant details on borrower and collateral performance on a security-by-security basis.
Assumptions including delinquencies, default rates, credit subordination support, prepayment rates, and loss
severity based on the underlying collateral characteristics and year of origination are considered to estimate the
future cash flows. Assumptions used can vary widely from loan to loan, and are influenced by such factors as
interest rates, geography, borrower specific data and underlying collateral. Expected future cash flows are then
calculated using a discount rate that management believes a market participant would consider in determining the
133