Regions Bank 2009 Annual Report Download - page 189
Download and view the complete annual report
Please find page 189 of the 2009 Regions Bank annual report below. You can navigate through the pages in the report by either clicking on the pages listed below, or by using the keyword search tool below to find specific information within the annual report.-
 1
1 -
2
-
3
-
4
-
5
-
6
-
7
-
8
-
9
-
10
-
11
-
12
-
13
-
14
-
15
-
16
-
17
-
18
-
19
-
20
-
21
-
22
-
23
-
24
-
25
-
26
-
27
-
28
-
29
-
30
-
31
-
32
-
33
-
34
-
35
-
36
-
37
-
38
-
39
-
40
-
41
-
42
-
43
-
44
-
45
-
46
-
47
-
48
-
49
-
50
-
51
-
52
-
53
-
54
-
55
-
56
-
57
-
58
-
59
-
60
-
61
-
62
-
63
-
64
-
65
-
66
-
67
-
68
-
69
-
70
-
71
-
72
-
73
-
74
-
75
-
76
-
77
-
78
-
79
-
80
-
81
-
82
-
83
-
84
-
85
-
86
-
87
-
88
-
89
-
90
-
91
-
92
-
93
-
94
-
95
-
96
-
97
-
98
-
99
-
100
-
101
-
102
-
103
-
104
-
105
-
106
-
107
-
108
-
109
-
110
-
111
-
112
-
113
-
114
-
115
-
116
-
117
-
118
-
119
-
120
-
121
-
122
-
123
-
124
-
125
-
126
-
127
-
128
-
129
-
130
-
131
-
132
-
133
-
134
-
135
-
136
-
137
-
138
-
139
-
140
-
141
-
142
-
143
-
144
-
145
-
146
-
147
-
148
-
149
-
150
-
151
-
152
-
153
-
154
-
155
-
156
-
157
-
158
-
159
-
160
-
161
-
162
-
163
-
164
-
165
-
166
-
167
-
168
-
169
-
170
-
171
-
172
-
173
-
174
-
175
-
176
-
177
-
178
-
 179
179 -
 180
180 -
 181
181 -
 182
182 -
 183
183 -
 184
184 -
 185
185 -
 186
186 -
 187
187 -
 188
188 -
 189
189 -
 190
190 -
 191
191 -
 192
192 -
 193
193 -
 194
194 -
 195
195 -
 196
196 -
 197
197 -
 198
198 -
 199
199 -
200
-
201
-
202
-
203
-
204
-
205
-
206
-
207
-
208
-
209
-
210
-
211
-
212
-
213
-
214
-
215
-
216
-
217
-
218
-
219
-
220
 |
 |
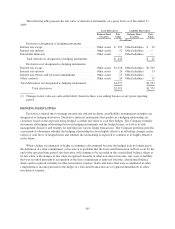
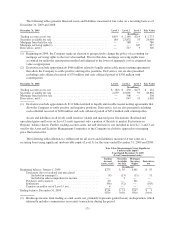
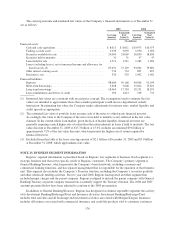
held for sale in the consolidated statements of operations. Net gains (losses) resulting from changes in fair value
of these loans of $7 million and $16 million, respectively, were recorded in mortgage income in the consolidated
statements of operations for the years ended December 31, 2009 and 2008. These changes in fair value are
mostly offset by economic hedging activities. An immaterial portion of this amount was attributable to changes
in instrument-specific credit risk.
The election of the fair value option impacts the timing and recognition of servicing value, as well as
origination fees and costs. The servicing value of a loan was precluded from being recognized until the sale of
the loan prior to the election of the fair value option. After adoption of the fair value option, this value is
recognized in the statement of operations at the time of origination. Origination fees and costs for mortgage loans
held for sale, which had been previously deferred, are now recognized in the statement of operations at the time
of origination. Prior to the election of the fair value option, net loan origination costs for mortgage loans held for
sale were capitalized as part of the carrying amount of the loans and recognized as a reduction of mortgage
income upon the sale of such loans. Approximately $10 million of loan servicing value was recognized in
non-interest income during 2008 related to the adoption of the fair value option. The net impact of ceasing
deferrals of origination fees and costs during 2008 related to the adoption of the fair value option was not
material.
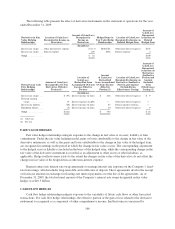
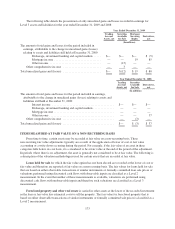
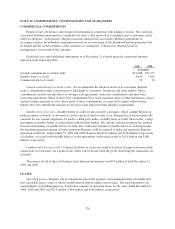
FAIR VALUE OF FINANCIAL INSTRUMENTS
The following methods and assumptions were used by the Company in estimating fair values of financial
instruments that are not disclosed above:
Cash and cash equivalents: The carrying amounts reported in the consolidated balance sheets and cash
flows approximate the estimated fair values.
Securities held to maturity: Estimated fair values are based on quoted market prices, where available. If
quoted market prices are not available, estimated fair values are based on quoted market prices of comparable
instruments and/or discounted cash flow analyses.
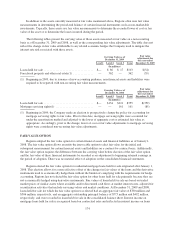
Loans, net: The fair values of loans, excluding leases, are estimated based on groupings of similar loans by
type, interest rate, and borrower creditworthiness. Discounted future cash flow analyses are performed for the
groupings incorporating assumptions of current and projected prepayment speeds. Discount rates are determined
using the Company’s current origination rates on similar loans, adjusted for changes in current liquidity and
credit spreads (if necessary) observed in market pricing.
Other interest-earning assets: The carrying amounts reported in the consolidated balance sheets
approximate the estimated fair values.
Deposits: The fair value of non-interest bearing demand accounts, interest-bearing transaction accounts,
savings accounts, money market accounts and certain other time deposit accounts is the amount payable on
demand at the reporting date (i.e., the carrying amount). Fair values for certificates of deposit are estimated by
using discounted cash flow analyses, based on market spreads to benchmark rates.
Short-term and long-term borrowings: The carrying amounts of short-term borrowings reported in the
consolidated balance sheets approximate the estimated fair values. The fair values of long-term borrowings are
estimated using quoted market prices. If quoted market prices are not available, fair values are estimated using
discounted future cash flow analyses based on current interest rates, liquidity and credit spreads.
Loan commitments and letters of credit: The estimated fair values for these off-balance sheet instruments
are based on probabilities of funding to project expected future cash flows, which are discounted using the loan
methodology described above. The premium/discounts are adjusted for the time value of money over the average
remaining life of the commitments and the opportunity cost associated with regulatory requirements.
175