Regions Bank 2009 Annual Report Download - page 151
Download and view the complete annual report
Please find page 151 of the 2009 Regions Bank annual report below. You can navigate through the pages in the report by either clicking on the pages listed below, or by using the keyword search tool below to find specific information within the annual report.-
 1
1 -
2
-
3
-
4
-
5
-
6
-
7
-
8
-
9
-
10
-
11
-
12
-
13
-
14
-
15
-
16
-
17
-
18
-
19
-
20
-
21
-
22
-
23
-
24
-
25
-
26
-
27
-
28
-
29
-
30
-
31
-
32
-
33
-
34
-
35
-
36
-
37
-
38
-
39
-
40
-
41
-
42
-
43
-
44
-
45
-
46
-
47
-
48
-
49
-
50
-
51
-
52
-
53
-
54
-
55
-
56
-
57
-
58
-
59
-
60
-
61
-
62
-
63
-
64
-
65
-
66
-
67
-
68
-
69
-
70
-
71
-
72
-
73
-
74
-
75
-
76
-
77
-
78
-
79
-
80
-
81
-
82
-
83
-
84
-
85
-
86
-
87
-
88
-
89
-
90
-
91
-
92
-
93
-
94
-
95
-
96
-
97
-
98
-
99
-
100
-
101
-
102
-
103
-
104
-
105
-
106
-
107
-
108
-
109
-
110
-
111
-
112
-
113
-
114
-
115
-
116
-
117
-
118
-
119
-
120
-
121
-
122
-
123
-
124
-
125
-
126
-
127
-
128
-
129
-
130
-
131
-
132
-
133
-
134
-
135
-
136
-
137
-
138
-
139
-
140
-
 141
141 -
 142
142 -
 143
143 -
 144
144 -
 145
145 -
 146
146 -
 147
147 -
 148
148 -
 149
149 -
 150
150 -
 151
151 -
 152
152 -
 153
153 -
 154
154 -
 155
155 -
 156
156 -
 157
157 -
 158
158 -
 159
159 -
 160
160 -
 161
161 -
162
-
163
-
164
-
165
-
166
-
167
-
168
-
169
-
170
-
171
-
172
-
173
-
174
-
175
-
176
-
177
-
178
-
179
-
180
-
181
-
182
-
183
-
184
-
185
-
186
-
187
-
188
-
189
-
190
-
191
-
192
-
193
-
194
-
195
-
196
-
197
-
198
-
199
-
200
-
201
-
202
-
203
-
204
-
205
-
206
-
207
-
208
-
209
-
210
-
211
-
212
-
213
-
214
-
215
-
216
-
217
-
218
-
219
-
220
 |
 |
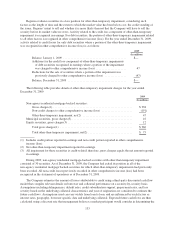
At December 31, 2009, non-accrual loans including loans held for sale totaled $3.8 billion, compared to
$1.5 billion at December 31, 2008. The amount of interest income recognized in 2009, 2008 and 2007 on
non-accrual loans was approximately $55 million, $41 million and $25 million, respectively. If these loans had
been current in accordance with their original terms, approximately $160 million, $116 million and $40 million,
respectively, would have been recognized on these loans in 2009, 2008 and 2007. At December 31, 2009 and
2008, Regions had loans contractually past due 90 days or more and still accruing of approximately $688 million
and $554 million, respectively.
Impaired loans are defined in Note 1. The recorded investment in impaired loans was $5.0 billion at
December 31, 2009 and $1.4 billion at December 31, 2008. The allowance allocated to impaired loans, excluding
TDRs, totaled $403 million and $130 million at December 31, 2009 and 2008, respectively. The allowance
allocated to TDRs totaled $38 million and $9 million at December 31, 2009 and 2008, respectively. The average
amount of impaired loans was $3.6 billion during 2009, $1.3 billion during 2008 and $396 million during 2007.
No material amount of interest income was recognized on impaired loans for the years ended December 31,
2009, 2008 or 2007.
In addition to the impaired loans discussed in the preceding paragraph, there were approximately $317
million and $423 million in nonperforming loans classified as held for sale at December 31, 2009 and 2008,
respectively. The loans are larger balance credits, primarily investor real estate. Management does not have the
intent to hold these loans for the foreseeable future. The loans are carried at an amount approximating a price
which will be recoverable through the loan sale market. Because the adjusted carrying value is lower than the
outstanding principal, these loans are considered impaired.
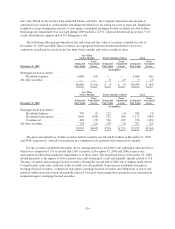
Regions had approximately $61 million and $77 million in book value of sub-prime loans retained from the
disposition of EquiFirst at December 31, 2009 and 2008, respectively. The credit loss exposure related to these
loans is addressed in management’s periodic determination of the allowance for credit losses.
As of December 31, 2009 and 2008, Regions had funded $626 million and $332 million, respectively, in
letters of credit backing Variable-Rate Demand Notes (“VRDNs”). An additional $61 million has been tendered
but not yet funded as of December 31, 2009. The remaining unfunded VRDN letters of credit portfolio at
December 31, 2009 was approximately $2.7 billion (net of participations).
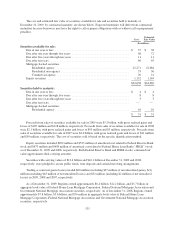
Regions’ recorded recourse liability, which primarily relates to residential mortgage loans, totaled $30
million and $32 million at December 31, 2009 and 2008, respectively. The recourse liability represents Regions’
estimated credit losses on contingent repurchases of loans or make-whole payments related to residential
mortgage loans previously sold. This recourse arises when debtors fail to pay for an initial period of time after
the loan is sold or due to defects in the underwriting of the sold loans.
Of the balances at December 31, 2009 and 2008, approximately $3.2 billion and $5.5 billion, respectively,
of first mortgage loans on one-to-four family dwellings, as well as $5.6 billion and $6.0 billion, respectively, of
home equity loans held by Regions were pledged to secure borrowings from the FHLB (see Note 13 for further
discussion). At December 31, 2009, approximately $8.3 billion of commercial and industrial loans, $9.9 billion
of owner-occupied loans, $7.9 billion of investor real estate loans and $1.8 billion of other consumer loans held
by Regions were pledged to the Federal Reserve Bank. At December 31, 2008, approximately $22.0 billion of
commercial loans and $3.1 billion of other consumer loans held by Regions were pledged to the Federal Reserve
Bank.
Directors and executive officers of Regions and its principal subsidiaries, including the directors’ and
officers’ families and affiliated companies, are loan and deposit customers and have other transactions with
Regions in the ordinary course of business. Total loans to these persons (excluding loans which in the aggregate
do not exceed $60,000 to any such person) at December 31, 2009 and 2008 were approximately $266 million and
$319 million, respectively. These loans were made in the ordinary course of business and on substantially the
same terms, including interest rates and collateral, as those prevailing at the same time for comparable
transactions with other persons and involve no unusual risk of collectability.
137