Regions Bank 2009 Annual Report Download - page 183
Download and view the complete annual report
Please find page 183 of the 2009 Regions Bank annual report below. You can navigate through the pages in the report by either clicking on the pages listed below, or by using the keyword search tool below to find specific information within the annual report.-
 1
1 -
2
-
3
-
4
-
5
-
6
-
7
-
8
-
9
-
10
-
11
-
12
-
13
-
14
-
15
-
16
-
17
-
18
-
19
-
20
-
21
-
22
-
23
-
24
-
25
-
26
-
27
-
28
-
29
-
30
-
31
-
32
-
33
-
34
-
35
-
36
-
37
-
38
-
39
-
40
-
41
-
42
-
43
-
44
-
45
-
46
-
47
-
48
-
49
-
50
-
51
-
52
-
53
-
54
-
55
-
56
-
57
-
58
-
59
-
60
-
61
-
62
-
63
-
64
-
65
-
66
-
67
-
68
-
69
-
70
-
71
-
72
-
73
-
74
-
75
-
76
-
77
-
78
-
79
-
80
-
81
-
82
-
83
-
84
-
85
-
86
-
87
-
88
-
89
-
90
-
91
-
92
-
93
-
94
-
95
-
96
-
97
-
98
-
99
-
100
-
101
-
102
-
103
-
104
-
105
-
106
-
107
-
108
-
109
-
110
-
111
-
112
-
113
-
114
-
115
-
116
-
117
-
118
-
119
-
120
-
121
-
122
-
123
-
124
-
125
-
126
-
127
-
128
-
129
-
130
-
131
-
132
-
133
-
134
-
135
-
136
-
137
-
138
-
139
-
140
-
141
-
142
-
143
-
144
-
145
-
146
-
147
-
148
-
149
-
150
-
151
-
152
-
153
-
154
-
155
-
156
-
157
-
158
-
159
-
160
-
161
-
162
-
163
-
164
-
165
-
166
-
167
-
168
-
169
-
170
-
171
-
172
-
 173
173 -
 174
174 -
 175
175 -
 176
176 -
 177
177 -
 178
178 -
 179
179 -
 180
180 -
 181
181 -
 182
182 -
 183
183 -
 184
184 -
 185
185 -
 186
186 -
 187
187 -
 188
188 -
 189
189 -
 190
190 -
 191
191 -
 192
192 -
 193
193 -
194
-
195
-
196
-
197
-
198
-
199
-
200
-
201
-
202
-
203
-
204
-
205
-
206
-
207
-
208
-
209
-
210
-
211
-
212
-
213
-
214
-
215
-
216
-
217
-
218
-
219
-
220
 |
 |
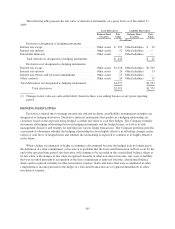
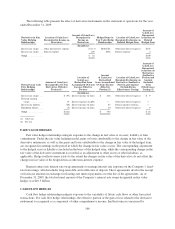
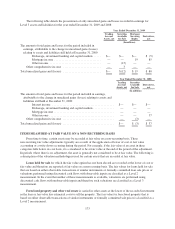
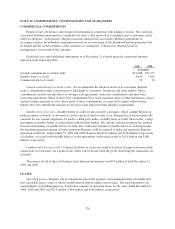
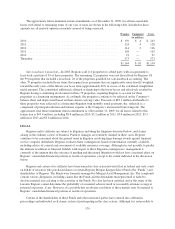
CREDIT DERIVATIVES
Regions has both bought and sold credit protection in the form of participations on interest rate swaps (swap
participations). These swap participations, which meet the definition of credit derivatives, were entered into in
the ordinary course of business to serve the credit needs of customers. Credit derivatives, whereby Regions has
purchased credit protection, entitle Regions to receive a payment from the counterparty when the customer fails
to make payment on any amounts due to Regions upon early termination of the swap transaction and have
maturities between 2012 and 2026. Credit derivatives whereby Regions has sold credit protection have maturities
between 2010 and 2015. For contracts where Regions sold credit protection, Regions would be required to make
payment to the counterparty when the customer fails to make payment on any amounts due to the counterparty
upon early termination of the swap transaction. Regions bases the current status of the prepayment/performance
risk on bought and sold credit derivatives on recently issued internal risk ratings consistent with the risk
management practices of unfunded commitments.
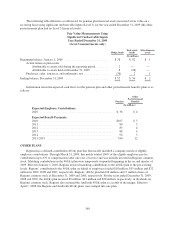
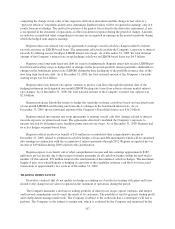
Regions’ maximum potential amount of future payments under these contracts is approximately $49 million.
This scenario would only occur if variable interest rates were at zero percent and all counterparties defaulted with
zero recovery. The fair value of sold protection at December 31, 2009, was immaterial. In transactions where
Regions has sold credit protection, recourse to collateral associated with the original swap transaction is available
to offset some or all of Regions’ obligation.
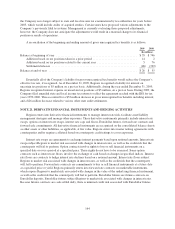
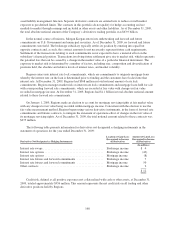
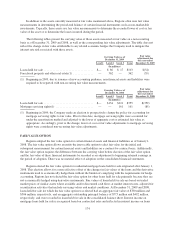
CONTINGENT FEATURES
Certain Regions’ derivative instruments contain provisions that require Regions Bank’s debt to maintain an
investment grade credit rating from major credit rating agencies. If Regions Bank’s debt were to fall below
investment grade, it would be in violation of these provisions, and the counterparties to the derivative instruments
could request immediate payment or demand immediate and ongoing full overnight collateralization on
derivative instruments in net liability positions. The aggregate fair value of all derivative instruments with credit-
risk-related contingent features that are in a liability position on December 31, 2009, was $347 million, for which
Regions had posted collateral of $336 million in the normal course of business. If the credit-risk-related
contingent features underlying these agreements were triggered on December 31, 2009, Regions would be
required to post an additional $11 million of collateral to its counterparties.
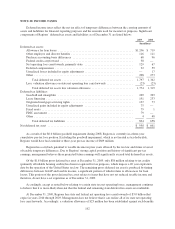
NOTE 22. FAIR VALUE MEASUREMENTS
Authoritative accounting literature establishes a framework for using fair value to measure assets and
liabilities and defines fair value as the price that would be received to sell an asset or paid to transfer a liability
(an exit price) as opposed to the price that would be paid to acquire the asset or received to assume the liability
(an entry price). A fair value measure should reflect the assumptions that market participants would use in
pricing the asset or liability, including the assumptions about the risk inherent in a particular valuation technique,
the effect of a restriction on the sale or use of an asset and the risk of nonperformance. Required disclosures
include stratification of balance sheet amounts measured at fair value based on inputs the Company uses to
derive fair value measurements. These strata include:
• Level 1 valuations, where the valuation is based on quoted market prices for identical assets or
liabilities traded in active markets (which include exchanges and over-the-counter markets with
sufficient volume),
• Level 2 valuations, where the valuation is based on quoted market prices for similar instruments traded
in active markets, quoted prices for identical or similar instruments in markets that are not active and
model-based valuation techniques for which all significant assumptions are observable in the market,
and
• Level 3 valuations, where the valuation is generated from model-based techniques that use significant
assumptions not observable in the market, but observable based on Company-specific data. These
169