Regions Bank 2009 Annual Report Download - page 105
Download and view the complete annual report
Please find page 105 of the 2009 Regions Bank annual report below. You can navigate through the pages in the report by either clicking on the pages listed below, or by using the keyword search tool below to find specific information within the annual report.-
 1
1 -
2
-
3
-
4
-
5
-
6
-
7
-
8
-
9
-
10
-
11
-
12
-
13
-
14
-
15
-
16
-
17
-
18
-
19
-
20
-
21
-
22
-
23
-
24
-
25
-
26
-
27
-
28
-
29
-
30
-
31
-
32
-
33
-
34
-
35
-
36
-
37
-
38
-
39
-
40
-
41
-
42
-
43
-
44
-
45
-
46
-
47
-
48
-
49
-
50
-
51
-
52
-
53
-
54
-
55
-
56
-
57
-
58
-
59
-
60
-
61
-
62
-
63
-
64
-
65
-
66
-
67
-
68
-
69
-
70
-
71
-
72
-
73
-
74
-
75
-
76
-
77
-
78
-
79
-
80
-
81
-
82
-
83
-
84
-
85
-
86
-
87
-
88
-
89
-
90
-
91
-
92
-
93
-
94
-
 95
95 -
 96
96 -
 97
97 -
 98
98 -
 99
99 -
 100
100 -
 101
101 -
 102
102 -
 103
103 -
 104
104 -
 105
105 -
 106
106 -
 107
107 -
 108
108 -
 109
109 -
 110
110 -
 111
111 -
 112
112 -
 113
113 -
 114
114 -
 115
115 -
116
-
117
-
118
-
119
-
120
-
121
-
122
-
123
-
124
-
125
-
126
-
127
-
128
-
129
-
130
-
131
-
132
-
133
-
134
-
135
-
136
-
137
-
138
-
139
-
140
-
141
-
142
-
143
-
144
-
145
-
146
-
147
-
148
-
149
-
150
-
151
-
152
-
153
-
154
-
155
-
156
-
157
-
158
-
159
-
160
-
161
-
162
-
163
-
164
-
165
-
166
-
167
-
168
-
169
-
170
-
171
-
172
-
173
-
174
-
175
-
176
-
177
-
178
-
179
-
180
-
181
-
182
-
183
-
184
-
185
-
186
-
187
-
188
-
189
-
190
-
191
-
192
-
193
-
194
-
195
-
196
-
197
-
198
-
199
-
200
-
201
-
202
-
203
-
204
-
205
-
206
-
207
-
208
-
209
-
210
-
211
-
212
-
213
-
214
-
215
-
216
-
217
-
218
-
219
-
220
 |
 |

In 2009, the economic downturn that began with the housing slowdown continued to negatively impact
consumer confidence. In turn, lower confidence levels negatively impacted demand for goods and services. The
lower demand impacted retail sales and led to increased vacancy rates and lower rent rolls for the commercial
real estate sector. High unemployment continued throughout 2009. While residential real estate price declines
moderated somewhat during 2009, overall valuations remained low when compared to the recent past. Property
valuation, unemployment and weak economic conditions have impacted Florida, north Georgia, and most other
areas within Regions’ footprint.
Portfolio Characteristics
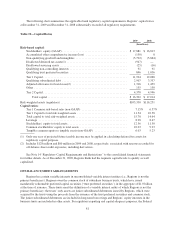
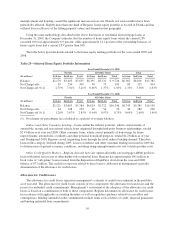
Regions has a diversified loan portfolio, in terms of product type, collateral and geography. At
December 31, 2009, commercial loans represented 38 percent of total loans, net of unearned income, investor
real estate loans represented 24 percent, residential first mortgage loans totaled 17 percent and other consumer
loans, largely home equity lending, comprised the remaining 21 percent. Following is a discussion of risk
characteristics of each loan type.
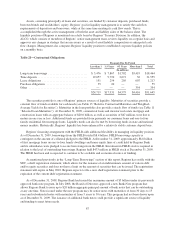
Commercial—The commercial loan portfolio totaled $34.4 billion at year-end 2009 and primarily consists
of loans to small and mid-sized commercial and large corporate customers with business operations in Regions’
geographic footprint. Loans in this portfolio are generally underwritten individually and are usually secured with
the assets of the company and/or the personal guarantee of the business owners. Also considered as commercial
loans are owner-occupied commercial real estate loans to businesses for long-term financing of land and
buildings. Regions attempts to minimize risk on owner-occupied properties by requiring collateral values that
exceed the loan amount, adequate cash flow to service the debt, and, in many cases, the personal guarantees of
principals of the borrowers. Net charge-offs on commercial loans were 1.28 percent in 2009 compared to 0.75
percent in 2008.
Investor Real Estate—The investor real estate portfolio totaled $21.7 billion at year-end 2009 and includes
various loan types. A large component of investor real estate loans is extensions of credit to real estate
developers and investors for the financing of land or buildings, where the repayment is generated from the sale of
the real estate or income generated by the real estate property. Net charge-offs on commercial investor real estate
mortgage loans rose substantially, from 2.37 percent in 2008 to 3.64 percent in 2009 in reaction to the dramatic
slowdown in demand for real estate properties and an associated drop in property valuations. Commercial
investor real estate construction loans are primarily extensions of credit to real estate developers or investors
where repayment is dependent on the sale of real estate or income generated from the real estate collateral. These
loans are generally underwritten and managed by a specialized real estate group that also manages loan
disbursements during the construction process. Net charge-offs on commercial investor real estate construction
loans rose substantially, from 5.70 percent in 2008 to 6.66 percent in 2009. Losses on sales or transfers to held
for sale of non-performing investor real estate loans also contributed to the year-over-year increase in net charge-
offs. In addition, the implications of a recession further pressured borrowers and contributed to higher losses.
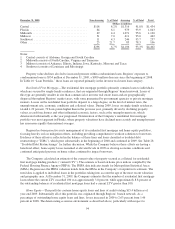
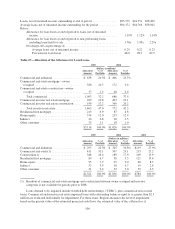
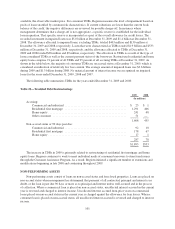
The following chart presents detail of Regions’ $21.7 billion investor real estate portfolio as of
December 31, 2009 (dollars in billions):
Single Family
$2.1 / 9% Condo - $0.6 / 3%
Other - $1.3 / 6%
Hotel - $1.0 / 5%
Industrial - $1.5 / 7%
Land
$3.0 / 14%
Office
$3.1 / 14%
Retail
$4.1 / 19%
Multi Family
$5.0 / 23%
91