Regions Bank 2009 Annual Report Download - page 173
Download and view the complete annual report
Please find page 173 of the 2009 Regions Bank annual report below. You can navigate through the pages in the report by either clicking on the pages listed below, or by using the keyword search tool below to find specific information within the annual report.-
 1
1 -
2
-
3
-
4
-
5
-
6
-
7
-
8
-
9
-
10
-
11
-
12
-
13
-
14
-
15
-
16
-
17
-
18
-
19
-
20
-
21
-
22
-
23
-
24
-
25
-
26
-
27
-
28
-
29
-
30
-
31
-
32
-
33
-
34
-
35
-
36
-
37
-
38
-
39
-
40
-
41
-
42
-
43
-
44
-
45
-
46
-
47
-
48
-
49
-
50
-
51
-
52
-
53
-
54
-
55
-
56
-
57
-
58
-
59
-
60
-
61
-
62
-
63
-
64
-
65
-
66
-
67
-
68
-
69
-
70
-
71
-
72
-
73
-
74
-
75
-
76
-
77
-
78
-
79
-
80
-
81
-
82
-
83
-
84
-
85
-
86
-
87
-
88
-
89
-
90
-
91
-
92
-
93
-
94
-
95
-
96
-
97
-
98
-
99
-
100
-
101
-
102
-
103
-
104
-
105
-
106
-
107
-
108
-
109
-
110
-
111
-
112
-
113
-
114
-
115
-
116
-
117
-
118
-
119
-
120
-
121
-
122
-
123
-
124
-
125
-
126
-
127
-
128
-
129
-
130
-
131
-
132
-
133
-
134
-
135
-
136
-
137
-
138
-
139
-
140
-
141
-
142
-
143
-
144
-
145
-
146
-
147
-
148
-
149
-
150
-
151
-
152
-
153
-
154
-
155
-
156
-
157
-
158
-
159
-
160
-
161
-
162
-
 163
163 -
 164
164 -
 165
165 -
 166
166 -
 167
167 -
 168
168 -
 169
169 -
 170
170 -
 171
171 -
 172
172 -
 173
173 -
 174
174 -
 175
175 -
 176
176 -
 177
177 -
 178
178 -
 179
179 -
 180
180 -
 181
181 -
 182
182 -
 183
183 -
184
-
185
-
186
-
187
-
188
-
189
-
190
-
191
-
192
-
193
-
194
-
195
-
196
-
197
-
198
-
199
-
200
-
201
-
202
-
203
-
204
-
205
-
206
-
207
-
208
-
209
-
210
-
211
-
212
-
213
-
214
-
215
-
216
-
217
-
218
-
219
-
220
 |
 |

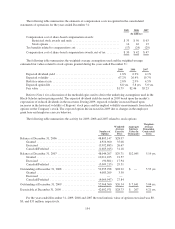
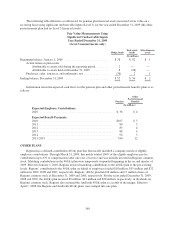
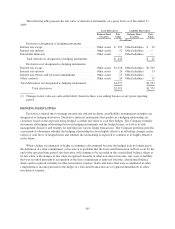
The expected long-term rate of return on plan assets is based on an estimated reasonable range of probable
returns. Management chose a point within the range based on the probability of achievement combined with
incremental returns attributable to active management.
The assumed health care cost trend rate for postretirement medical benefits was 7.0% for 2009 and is
assumed to decrease gradually to 4.5% by 2027 and remain at that level thereafter.
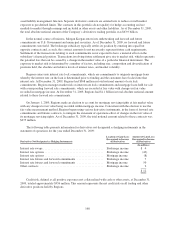
A one-percentage point change in assumed health care cost trend rates would have the following effects:
1-Percentage
Point Increase
1-Percentage
Point Decrease
(In thousands)
Effect on total of service cost and interest cost
components ..................................... $ 60 $ (55)
Effect on postretirement benefit obligations .............. 1,177 (1,074)
The pension plan’s investment strategy is shifting from focusing on maximizing asset returns to minimizing
funding ratio volatility, with an increase to the allocation to bonds. The target asset allocation is 43% equities,
32% fixed income securities and 25% in all other types of investments. Equity securities include investments in
large and small/mid cap companies primarily located in the United States as well as investments in international
equities. Fixed income securities include investments in corporate and government bonds, asset-backed securities
and any other fixed income investments as allowed by respective prospectuses and other offering documents.
Other types of investments may include hedge funds, real estate funds, and private equity funds that follow
several different strategies. Plan assets are highly diversified with respect to asset class, security and manager.
Investment risk is controlled with plan assets rebalancing to target allocations on a periodic basis and continual
monitoring of investment manager’s performance relative to the investment guidelines established with each
investment manager.
The Regions pension plan has a portion of its investments in Regions common stock. The number of shares
held by the plan was 2,839,446, which represents approximately 1.2% of the plan assets, at December 31, 2009,
for a total market value of $15 million.
The following table presents the fair value of Regions’ defined-benefit pension plans and other
postretirement plan financial assets as of December 31, 2009:
Level 1 Level 2 Level 3 Fair Value
(In millions)
Cash and cash equivalents(1) ......................... $183 $— $— $ 183
Fixed income securities .............................. — 325 — 325
Common stock .................................... 329 — — 329
Mutual funds ...................................... 309 — — 309
Hedge funds ...................................... — — 52 52
Real estate funds ................................... — — 56 56
Miscellaneous assets ................................ — — 2 2
Total ................................................................ $1,256
(1) This amount includes the other postretirement plan financial assets of approximately $4 million.
For all investments, quoted market prices of identical assets on active exchanges, or Level 1 measurements,
are used if available. Where such quoted market prices are not available, quoted market prices of similar
instruments (including matrix pricing) and/or discounted cash flows to estimate a value of these securities, or
Level 2 measurements are utilized. Level 2 discounted cash flow analyses are typically based on market interest
rates, prepayment speeds and/or option adjusted spreads. Level 3 measurements are based on assumptions that
are not readily observable in the market place.
159