Regions Bank 2009 Annual Report Download - page 162
Download and view the complete annual report
Please find page 162 of the 2009 Regions Bank annual report below. You can navigate through the pages in the report by either clicking on the pages listed below, or by using the keyword search tool below to find specific information within the annual report.-
 1
1 -
2
-
3
-
4
-
5
-
6
-
7
-
8
-
9
-
10
-
11
-
12
-
13
-
14
-
15
-
16
-
17
-
18
-
19
-
20
-
21
-
22
-
23
-
24
-
25
-
26
-
27
-
28
-
29
-
30
-
31
-
32
-
33
-
34
-
35
-
36
-
37
-
38
-
39
-
40
-
41
-
42
-
43
-
44
-
45
-
46
-
47
-
48
-
49
-
50
-
51
-
52
-
53
-
54
-
55
-
56
-
57
-
58
-
59
-
60
-
61
-
62
-
63
-
64
-
65
-
66
-
67
-
68
-
69
-
70
-
71
-
72
-
73
-
74
-
75
-
76
-
77
-
78
-
79
-
80
-
81
-
82
-
83
-
84
-
85
-
86
-
87
-
88
-
89
-
90
-
91
-
92
-
93
-
94
-
95
-
96
-
97
-
98
-
99
-
100
-
101
-
102
-
103
-
104
-
105
-
106
-
107
-
108
-
109
-
110
-
111
-
112
-
113
-
114
-
115
-
116
-
117
-
118
-
119
-
120
-
121
-
122
-
123
-
124
-
125
-
126
-
127
-
128
-
129
-
130
-
131
-
132
-
133
-
134
-
135
-
136
-
137
-
138
-
139
-
140
-
141
-
142
-
143
-
144
-
145
-
146
-
147
-
148
-
149
-
150
-
151
-
 152
152 -
 153
153 -
 154
154 -
 155
155 -
 156
156 -
 157
157 -
 158
158 -
 159
159 -
 160
160 -
 161
161 -
 162
162 -
 163
163 -
 164
164 -
 165
165 -
 166
166 -
 167
167 -
 168
168 -
 169
169 -
 170
170 -
 171
171 -
 172
172 -
173
-
174
-
175
-
176
-
177
-
178
-
179
-
180
-
181
-
182
-
183
-
184
-
185
-
186
-
187
-
188
-
189
-
190
-
191
-
192
-
193
-
194
-
195
-
196
-
197
-
198
-
199
-
200
-
201
-
202
-
203
-
204
-
205
-
206
-
207
-
208
-
209
-
210
-
211
-
212
-
213
-
214
-
215
-
216
-
217
-
218
-
219
-
220
 |
 |

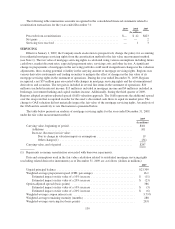
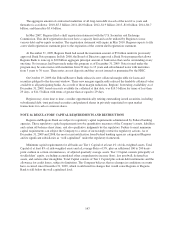
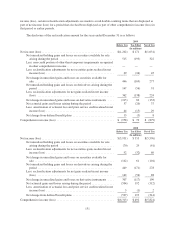
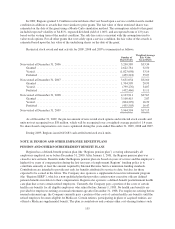
Regions’ and its banking subsidiary’s capital levels at December 31 exceeded both the minimum and “well
capitalized” levels, as shown below:
December 31, 2009 To Be Well
CapitalizedAmount Ratio
(Dollars in millions)
Tier 1 Common (non-GAAP):
Regions Financial Corporation ..................................... $ 7,385 7.15% NA(1)
Tier 1 Capital:
Regions Financial Corporation ..................................... $11,924 11.54% 6.00%
Regions Bank ................................................... 10,577 10.36 6.00
Total Capital:
Regions Financial Corporation ..................................... $16,303 15.78% 10.00%
Regions Bank ................................................... 13,935 13.65 10.00
Leverage:
Regions Financial Corporation ..................................... $11,924 8.90% 5.00%
Regions Bank ................................................... 10,577 8.05 5.00
December 31, 2008 To Be Well
CapitalizedAmount Ratio
(Dollars in millions)
Tier 1 Common (non-GAAP):
Regions Financial Corporation ..................................... $ 7,634 6.57% NA(1)
Tier 1 Capital:
Regions Financial Corporation ..................................... $12,068 10.38% 6.00%
Regions Bank ................................................... 9,640 8.41 6.00
Total Capital:
Regions Financial Corporation ..................................... $17,014 14.64% 10.00%
Regions Bank ................................................... 13,233 11.55 10.00
Leverage:
Regions Financial Corporation ..................................... $12,068 8.47% 5.00%
Regions Bank ................................................... 9,640 6.91 5.00
(1) The Board of Governors of the Federal Reserve System has identified 4% as the level of Tier 1 Common
capital sufficient to withstand adverse economic scenarios.
Regions Bank is required to maintain reserve balances with the Federal Reserve Bank. The average amount
of the reserve balances maintained for the years ended December 31, 2009 and 2008, was approximately $35
million and $73 million, respectively.
Substantially all net assets are owned by subsidiaries. The primary source of operating cash available to
Regions is provided by dividends from subsidiaries. Statutory limits are placed on the amount of dividends the
subsidiary bank can pay without prior regulatory approval. In addition, regulatory authorities require the
maintenance of minimum capital-to-asset ratios at banking subsidiaries. Under the Federal Reserve’s Regulation
H, Regions Bank may not, without approval of the Federal Reserve, declare or pay a dividend to Regions if the
total of all dividends declared in a calendar year exceeds the total of (a) Regions Bank’s net income for that year
and (b) its retained net income for the preceding two calendar years, less any required transfers to additional
paid-in capital or to a fund for the retirement of preferred stock. As a result of the losses incurred by Regions
Bank in 2009 and 2008, Regions Bank cannot, without approval from the Federal Reserve, declare or pay a
dividend to Regions until such time as Regions Bank is able to satisfy the criteria discussed in the preceding
sentence. Given the losses in 2009 and 2008, Regions Bank does not expect to be able to pay dividends to
Regions in the near term without obtaining regulatory approval. In addition to dividend restrictions, Federal
statutes also prohibit unsecured loans from banking subsidiaries to the parent company. Because of these
limitations, substantially all of the net assets of Regions’ subsidiaries are restricted.
148